Free Access
Fig. 6.
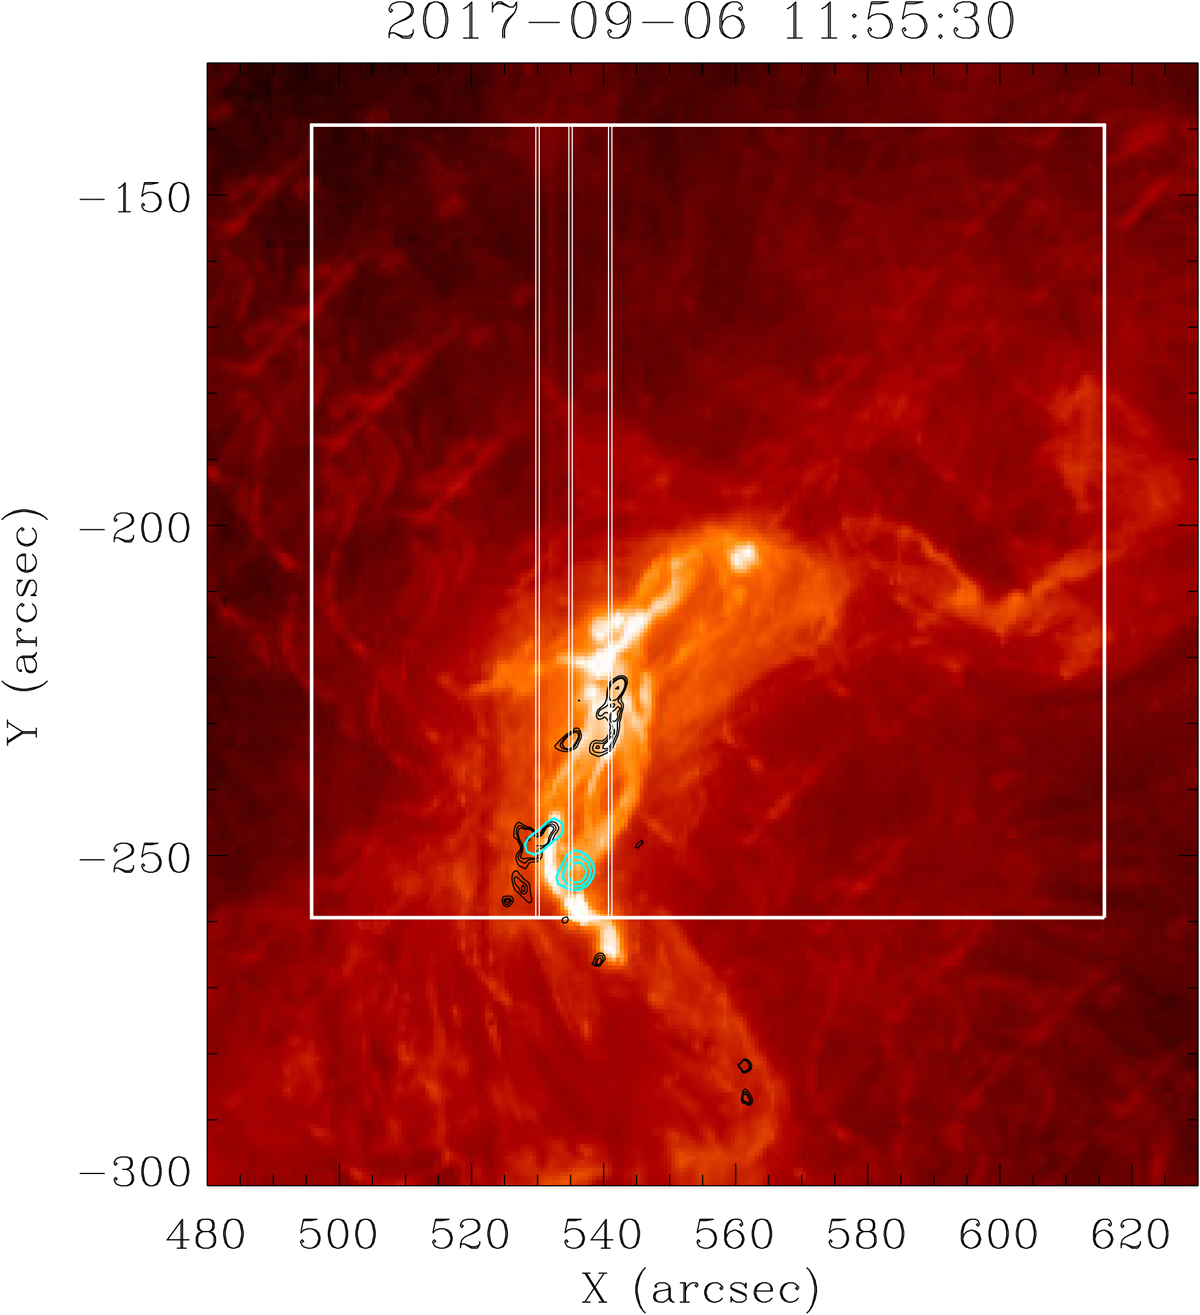
AIA He II 304 Å image showing the EIS FOV (white box); the 6 mHz egression contours (black) and the 30–60 keV HXR emission (cyan contours) obtained at 12:08:26 UT. The white vertical lines indicate the location of the EIS slits with respect to the main egression sources within the EIS FOV.
Current usage metrics show cumulative count of Article Views (full-text article views including HTML views, PDF and ePub downloads, according to the available data) and Abstracts Views on Vision4Press platform.
Data correspond to usage on the plateform after 2015. The current usage metrics is available 48-96 hours after online publication and is updated daily on week days.
Initial download of the metrics may take a while.