Free Access
Fig. 5.
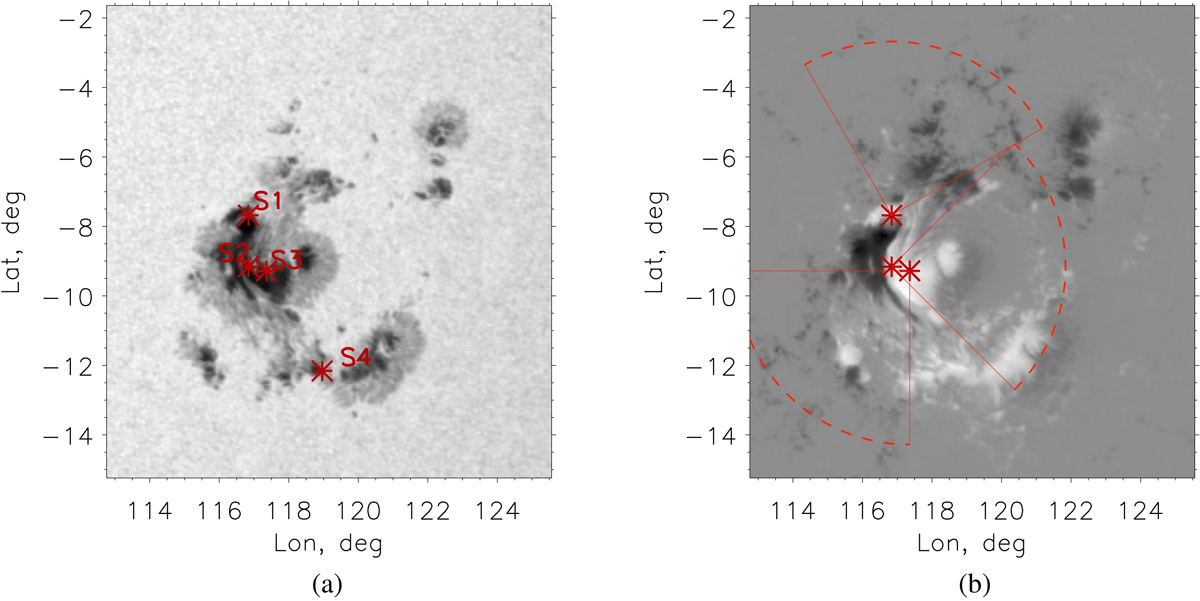
Panel a: HMI white light image of the active region marked with the egression maps of the seismic sources 1–4; panel b: directivity maps of seismic sources 1–3 derived with directional holography shown by the sectors with detectable acoustic signals marked by the solid and dashed red lines.
Current usage metrics show cumulative count of Article Views (full-text article views including HTML views, PDF and ePub downloads, according to the available data) and Abstracts Views on Vision4Press platform.
Data correspond to usage on the plateform after 2015. The current usage metrics is available 48-96 hours after online publication and is updated daily on week days.
Initial download of the metrics may take a while.