Free Access
Fig. 4.
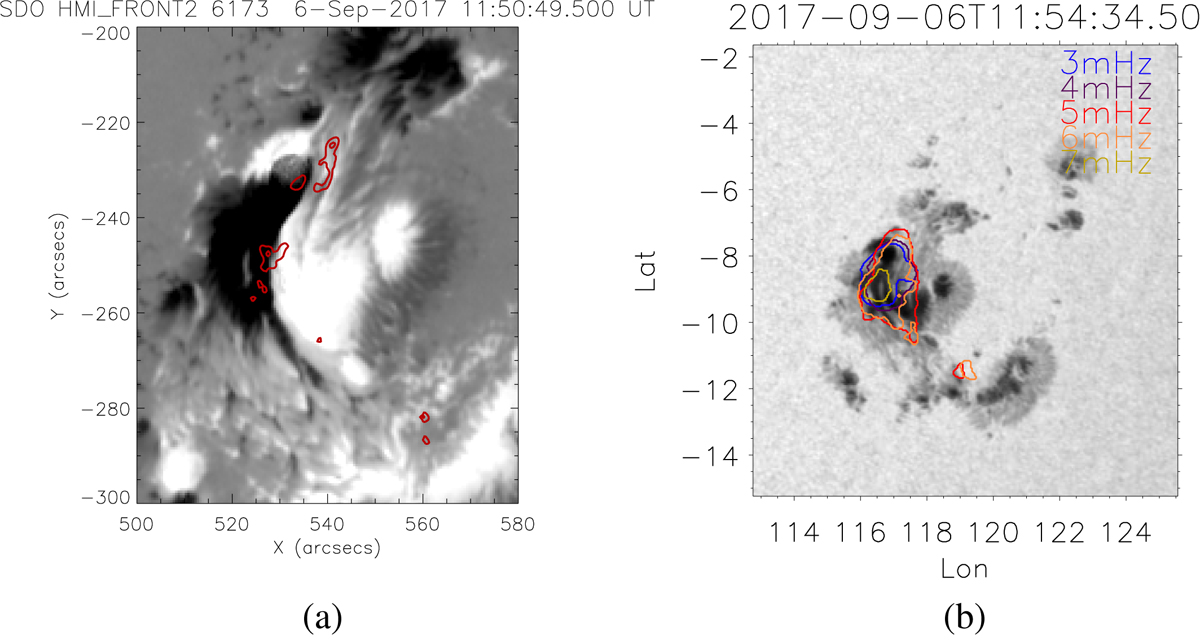
Panel a: HMI magnetogram of the active region overplotted with egression maps at 6 mHz only. Panel b: contours of the egression maps of sunquakes 1–4 in different frequencies marked by different colours over-imposed on the WL image.
Current usage metrics show cumulative count of Article Views (full-text article views including HTML views, PDF and ePub downloads, according to the available data) and Abstracts Views on Vision4Press platform.
Data correspond to usage on the plateform after 2015. The current usage metrics is available 48-96 hours after online publication and is updated daily on week days.
Initial download of the metrics may take a while.