Fig. 3.
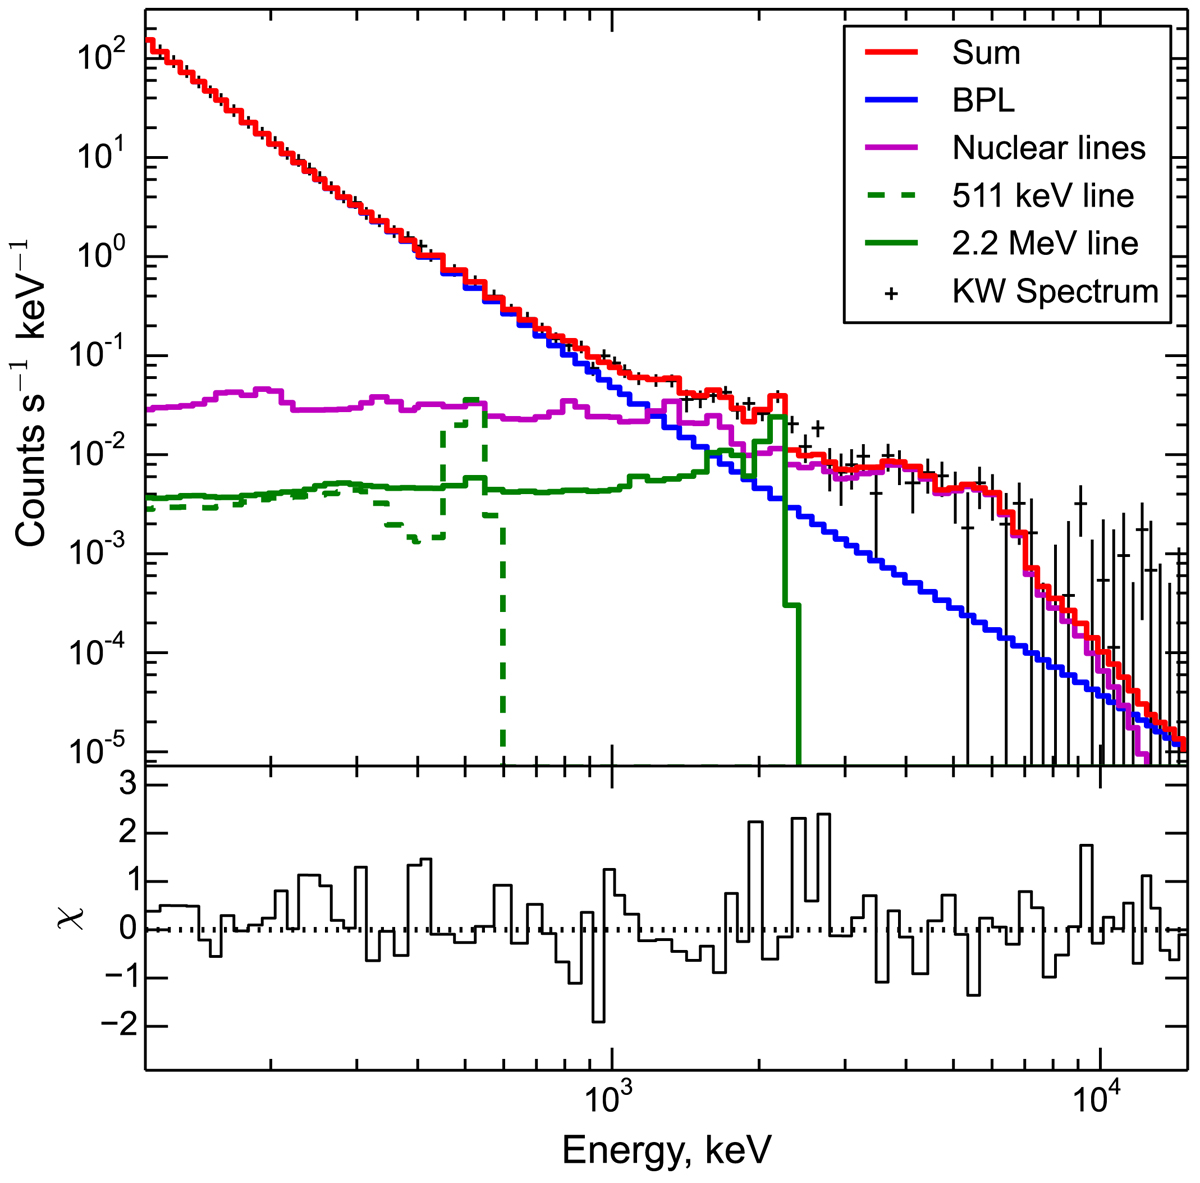
Fitting of the time-integrated spectrum by the broken power law+NUCLEAR+511keV+2.2 MeV model (Lysenko et al. 2019). The component colour codes are given in the panel. The Konus/Wind (KW) data are shown using symbols, where the horizontal dashes indicate the energy range of each data point, while the vertical dashes indicate the corresponding statistical errors. The lower panel shows the fit residual. Adopted from Fig. 3 of Lysenko et al. (2019).
Current usage metrics show cumulative count of Article Views (full-text article views including HTML views, PDF and ePub downloads, according to the available data) and Abstracts Views on Vision4Press platform.
Data correspond to usage on the plateform after 2015. The current usage metrics is available 48-96 hours after online publication and is updated daily on week days.
Initial download of the metrics may take a while.