Fig. 2.
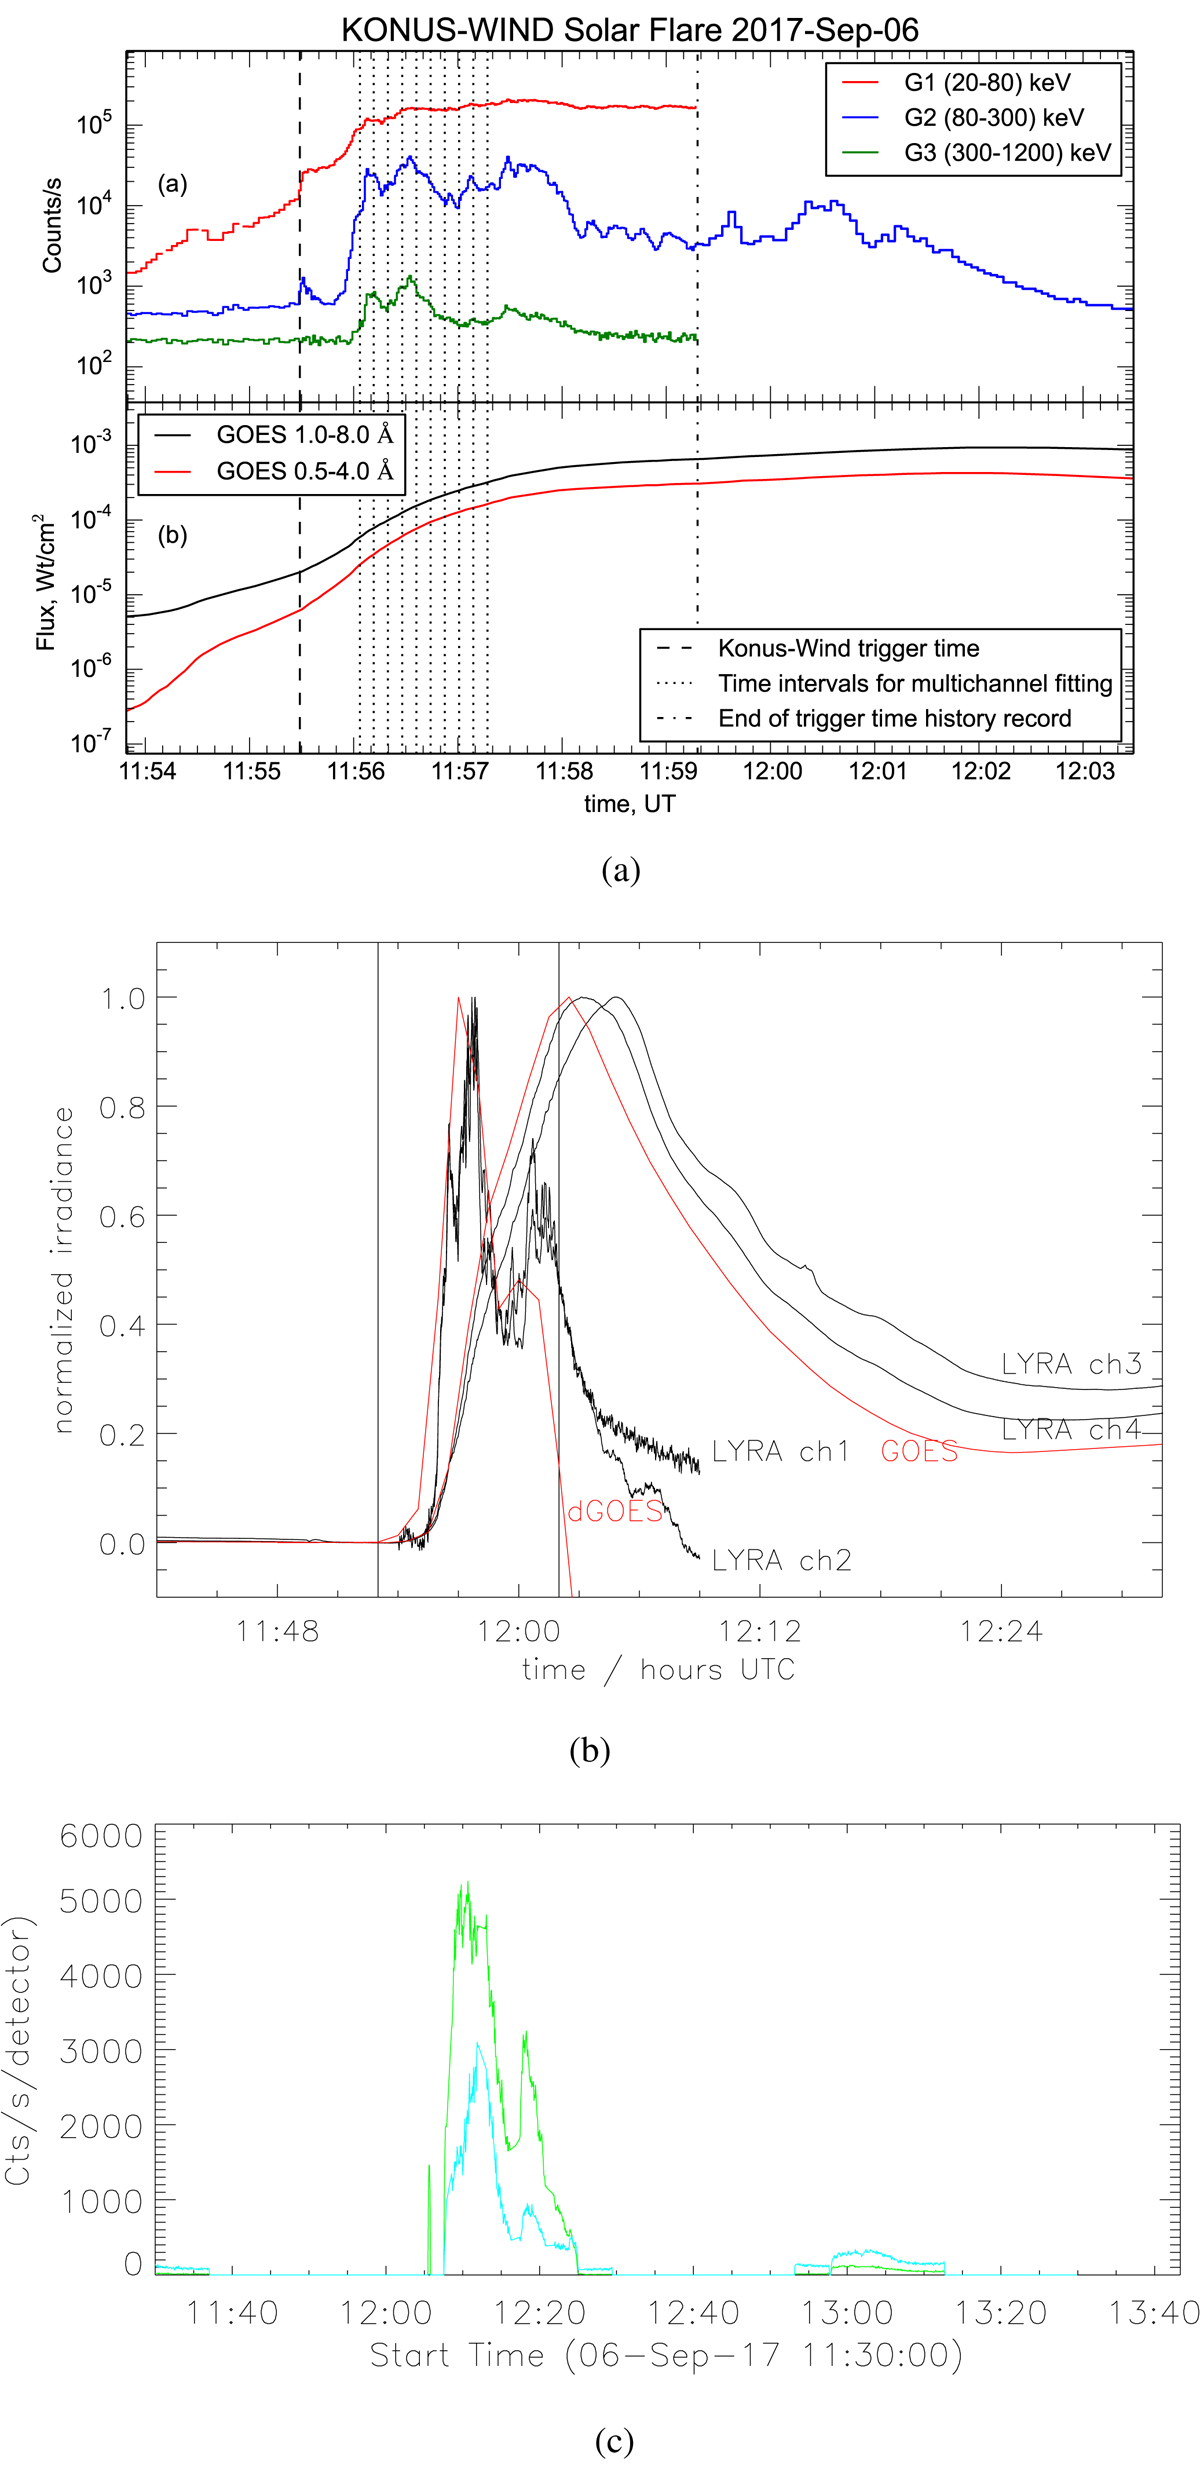
Light curves of the X9.3 flare. Panel a: light curves by the KONUS instruments (upper plot) and by GOES (bottom plot). Panel b: light curve in Ly-α line observed by the LYRA instrument (Hochedez et al. 2006; Dominique et al. 2013) showing flaring events 1 (after 11:55 UT) and 2 (after 12:04 UT, see the text for details). Panel c: light curves of HXR emission during or after the flaring event 2 observed after 12:08 UT by RHESSI, green line −25–50 keV; cyan line: 50–100 keV (scaled).
Current usage metrics show cumulative count of Article Views (full-text article views including HTML views, PDF and ePub downloads, according to the available data) and Abstracts Views on Vision4Press platform.
Data correspond to usage on the plateform after 2015. The current usage metrics is available 48-96 hours after online publication and is updated daily on week days.
Initial download of the metrics may take a while.