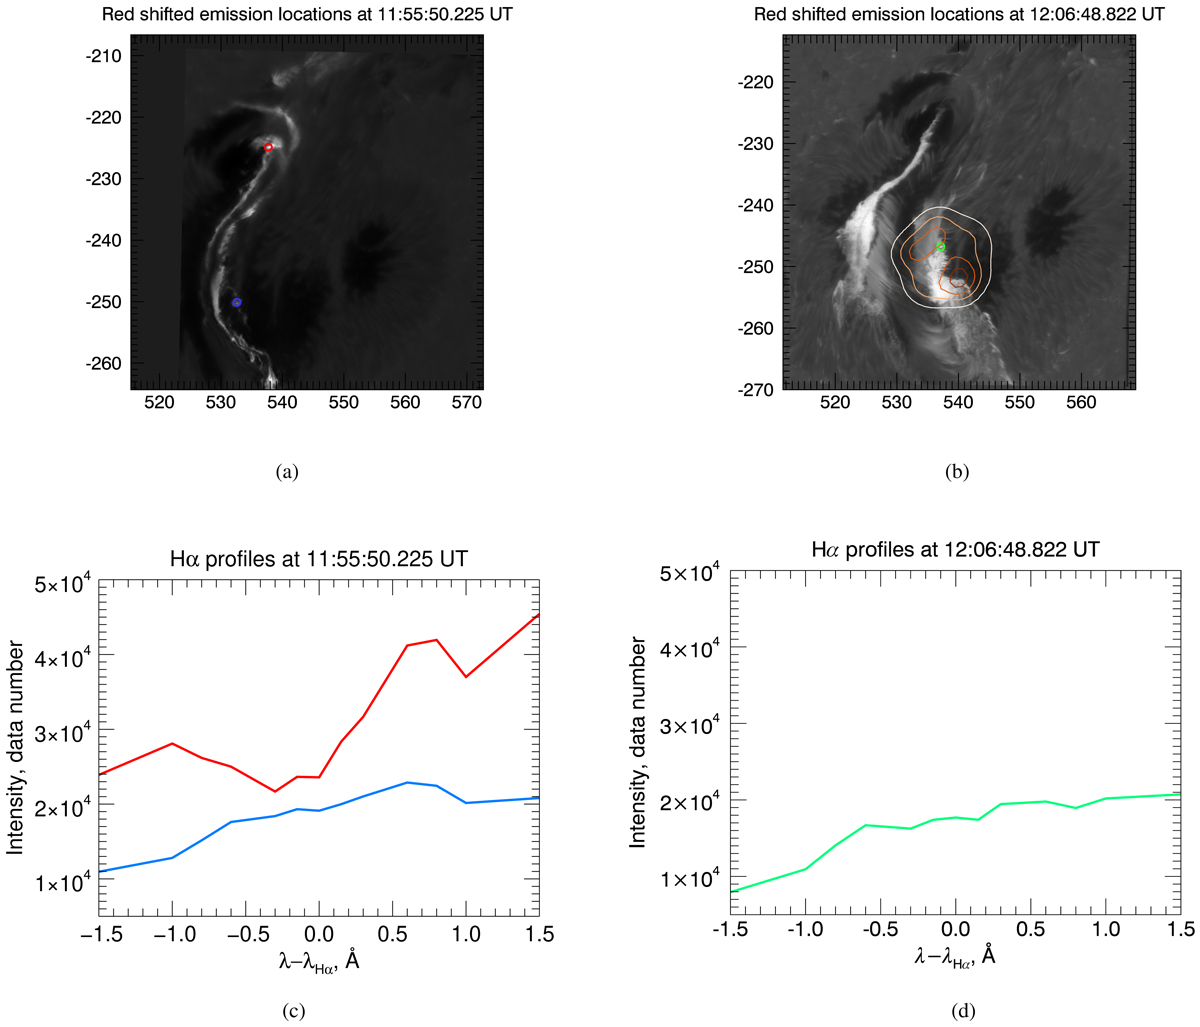
Fig. 14.

Top panels: red wing emission (λHα+ 1.5 Å) in the Hα line at 11:55:50 UT (flaring event 1) with the locations of (a) kernel 1 (seismic source 1) and kernel 2 (seismic source 2), shown by the red and blue circles, respectively, and the location of (b) kernel 3 (flaring event 2), marked by the green circle, observed at 12:06:48 UT. Bottom panels (c) Hα line profiles in kernel 1 (red line) and kernel 2 (blue line) and (d) kernel 3 (green line) obtained with SST (arbitrary units) by taking the average over the pixels. The HXR contours obtained at 12:08:26 UT are over-plotted for the 25–50 keV channel with the contours at 0.25 of maximal intensity (white), 0.48 (light brown), 0.7 (medium brown), and 0.9 (dark brown).
Current usage metrics show cumulative count of Article Views (full-text article views including HTML views, PDF and ePub downloads, according to the available data) and Abstracts Views on Vision4Press platform.
Data correspond to usage on the plateform after 2015. The current usage metrics is available 48-96 hours after online publication and is updated daily on week days.
Initial download of the metrics may take a while.


