Free Access
Fig. 12.
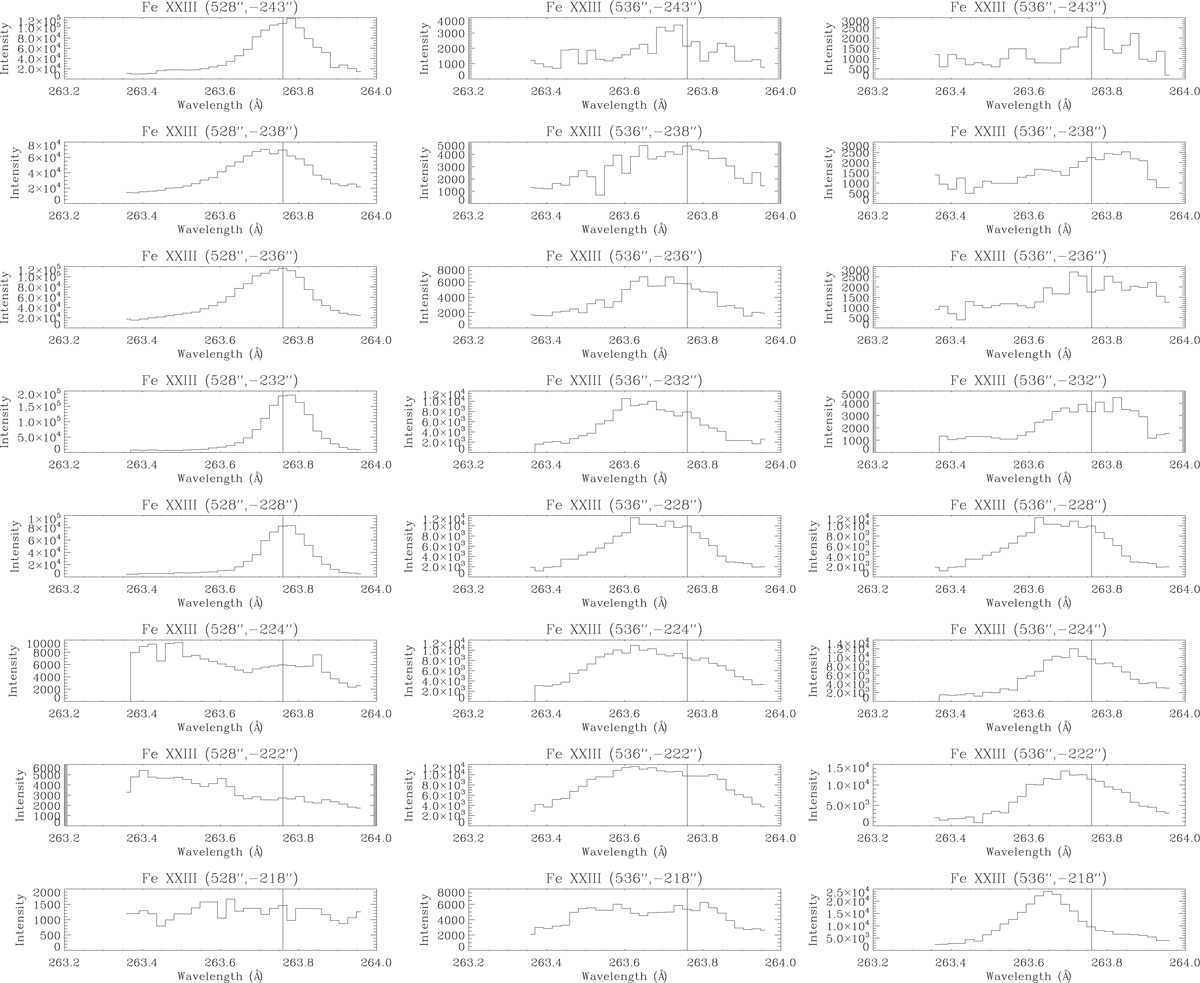
Flaring event 1 (>11:55 UT): EIS Fe XXIII line profiles from the selected locations at the slit positions associated with the locations of SQs 1, 2, and 3. Heliocentric location is indicated above each profile. The vertical lines indicate the rest wavelength.
Current usage metrics show cumulative count of Article Views (full-text article views including HTML views, PDF and ePub downloads, according to the available data) and Abstracts Views on Vision4Press platform.
Data correspond to usage on the plateform after 2015. The current usage metrics is available 48-96 hours after online publication and is updated daily on week days.
Initial download of the metrics may take a while.