Fig. 4.
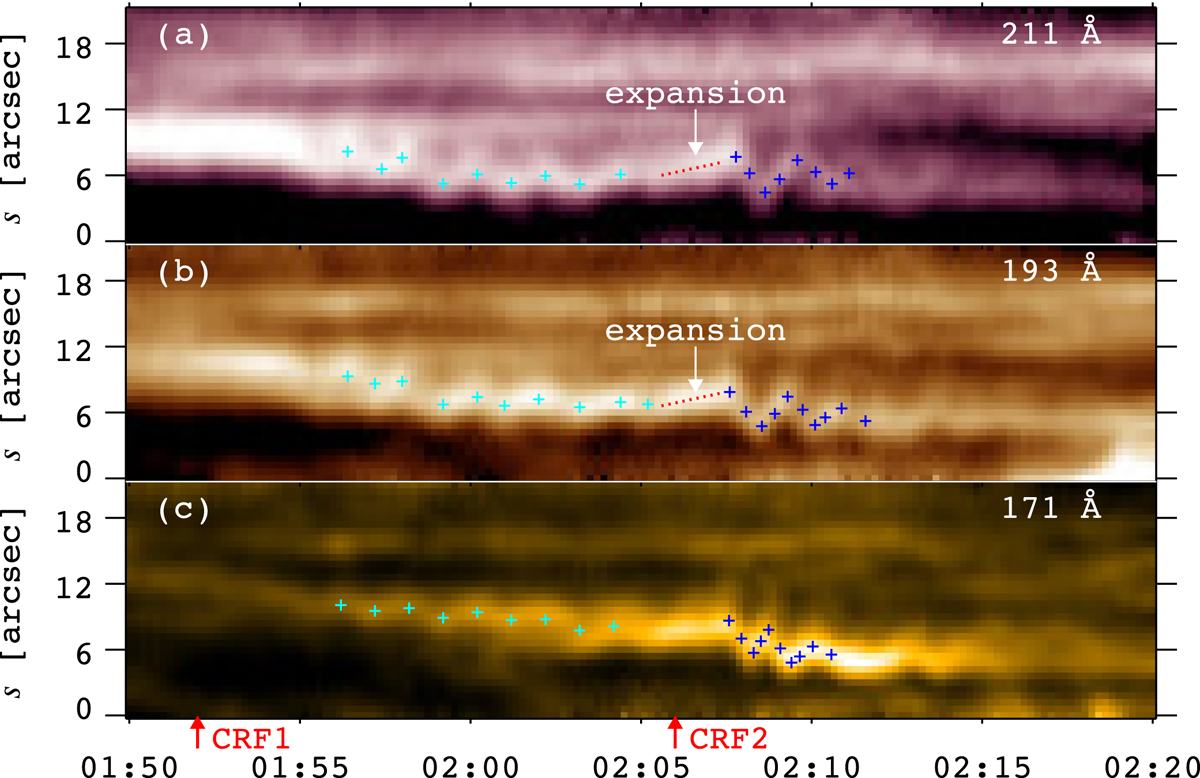
Time-distance diagrams of S0 in different wavelengths, showing the transverse oscillations of the EUV loop. The cyan (blue) plus symbols denote the central positions of the loop excited by CRF1 (CRF2). The red dotted lines indicate slow expansion of the loop before CRF2. The red arrows on the x-axis signify the starting times of CRF1 and CRF2 in SXR. On the y-axis, s = 0 and s = 21″ denote the northeast and southwest endpoints of S0, respectively.
Current usage metrics show cumulative count of Article Views (full-text article views including HTML views, PDF and ePub downloads, according to the available data) and Abstracts Views on Vision4Press platform.
Data correspond to usage on the plateform after 2015. The current usage metrics is available 48-96 hours after online publication and is updated daily on week days.
Initial download of the metrics may take a while.