Fig. 2.
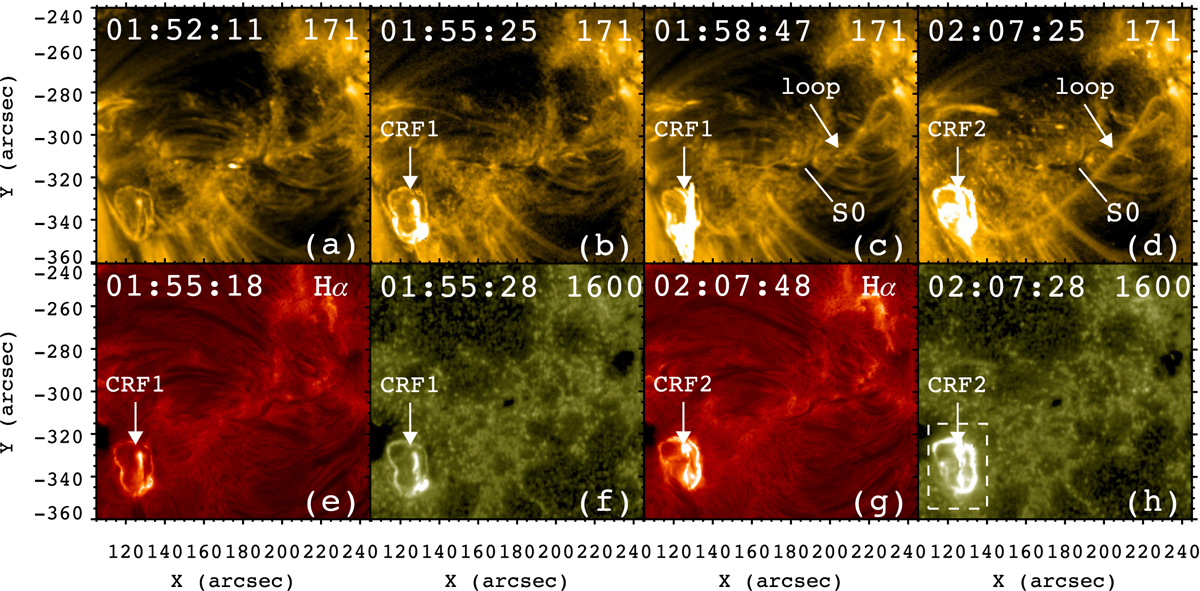
Snapshots of the AIA 171 Å, 1600 Å, and Hα images. The arrows point to CRF1, CRF2, and the EUV loop that experiences kink oscillations. The slice (S0) is used to investigate the loop oscillations. The dashed box in panel h signifies the flare region. The whole evolution is shown in a movie (anim171.mov) that is available online.
Current usage metrics show cumulative count of Article Views (full-text article views including HTML views, PDF and ePub downloads, according to the available data) and Abstracts Views on Vision4Press platform.
Data correspond to usage on the plateform after 2015. The current usage metrics is available 48-96 hours after online publication and is updated daily on week days.
Initial download of the metrics may take a while.