Open Access
Fig. C.4.
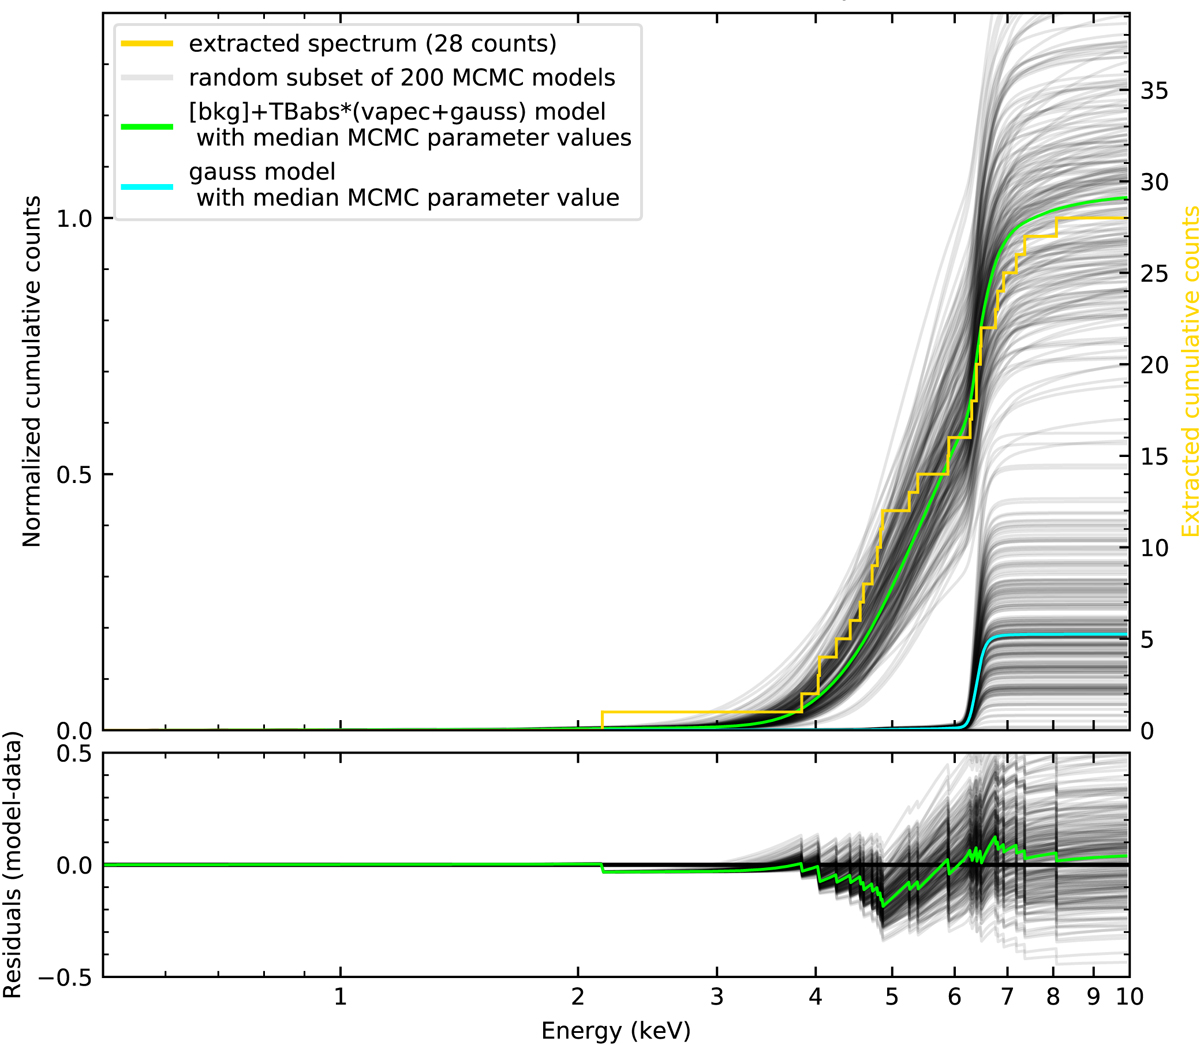
X-ray spectrum of HOPS 383 and Markov chain Monte Carlo (MCMC) models. Top panel: source-plus-background extracted cumulative spectrum (gold) and median MCMC model (green), 6.4 keV Gaussian emission line with median MCMC model (cyan), and a random subset of 200 MCMC models (gray). Bottom panel: model-minus-data residuals.
Current usage metrics show cumulative count of Article Views (full-text article views including HTML views, PDF and ePub downloads, according to the available data) and Abstracts Views on Vision4Press platform.
Data correspond to usage on the plateform after 2015. The current usage metrics is available 48-96 hours after online publication and is updated daily on week days.
Initial download of the metrics may take a while.