Fig. C.3.
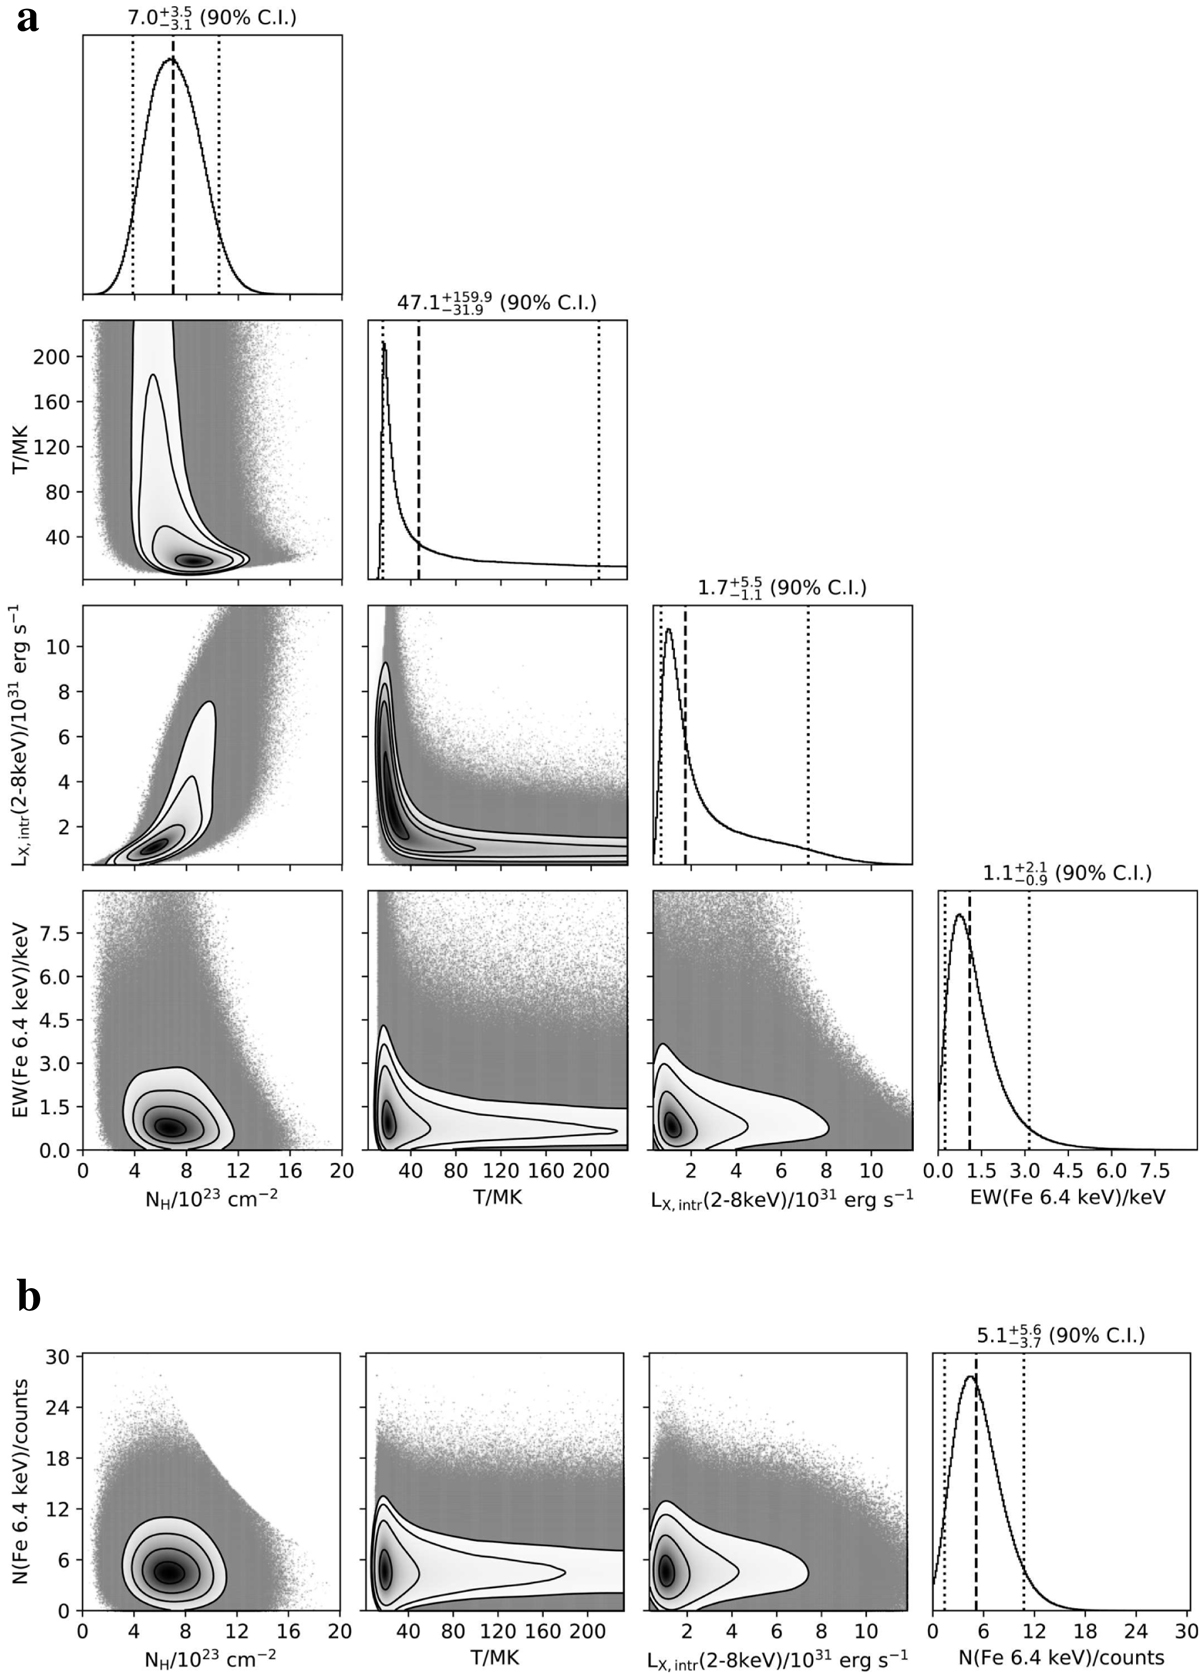
Posterior probability and covariance distributions of the flare-emission model parameters. Panel a: hydrogen column density, plasma temperature, X-ray intrinsic luminosity in the 2−8 keV range, and equivalent width of the Fe line at 6.4 keV. The size of the MCMC samples is about 4.6 × 10⁷ with about 4.5 × 10⁴ independent MCMC samples. The dashed and dotted vertical lines in the diagonal plots show the median value and the 90% confidence interval (C.I.) for each parameter. The contours in the other plots are 11.8, 39.3, 67.5, and 86.5% C.I. (corresponding to 0.5, 1, 1.5, and 2σ levels for a 2D Gaussian) for each pair of parameters. Panel b: alternative last row with count number from the emission line.
Current usage metrics show cumulative count of Article Views (full-text article views including HTML views, PDF and ePub downloads, according to the available data) and Abstracts Views on Vision4Press platform.
Data correspond to usage on the plateform after 2015. The current usage metrics is available 48-96 hours after online publication and is updated daily on week days.
Initial download of the metrics may take a while.