Fig. C.2.
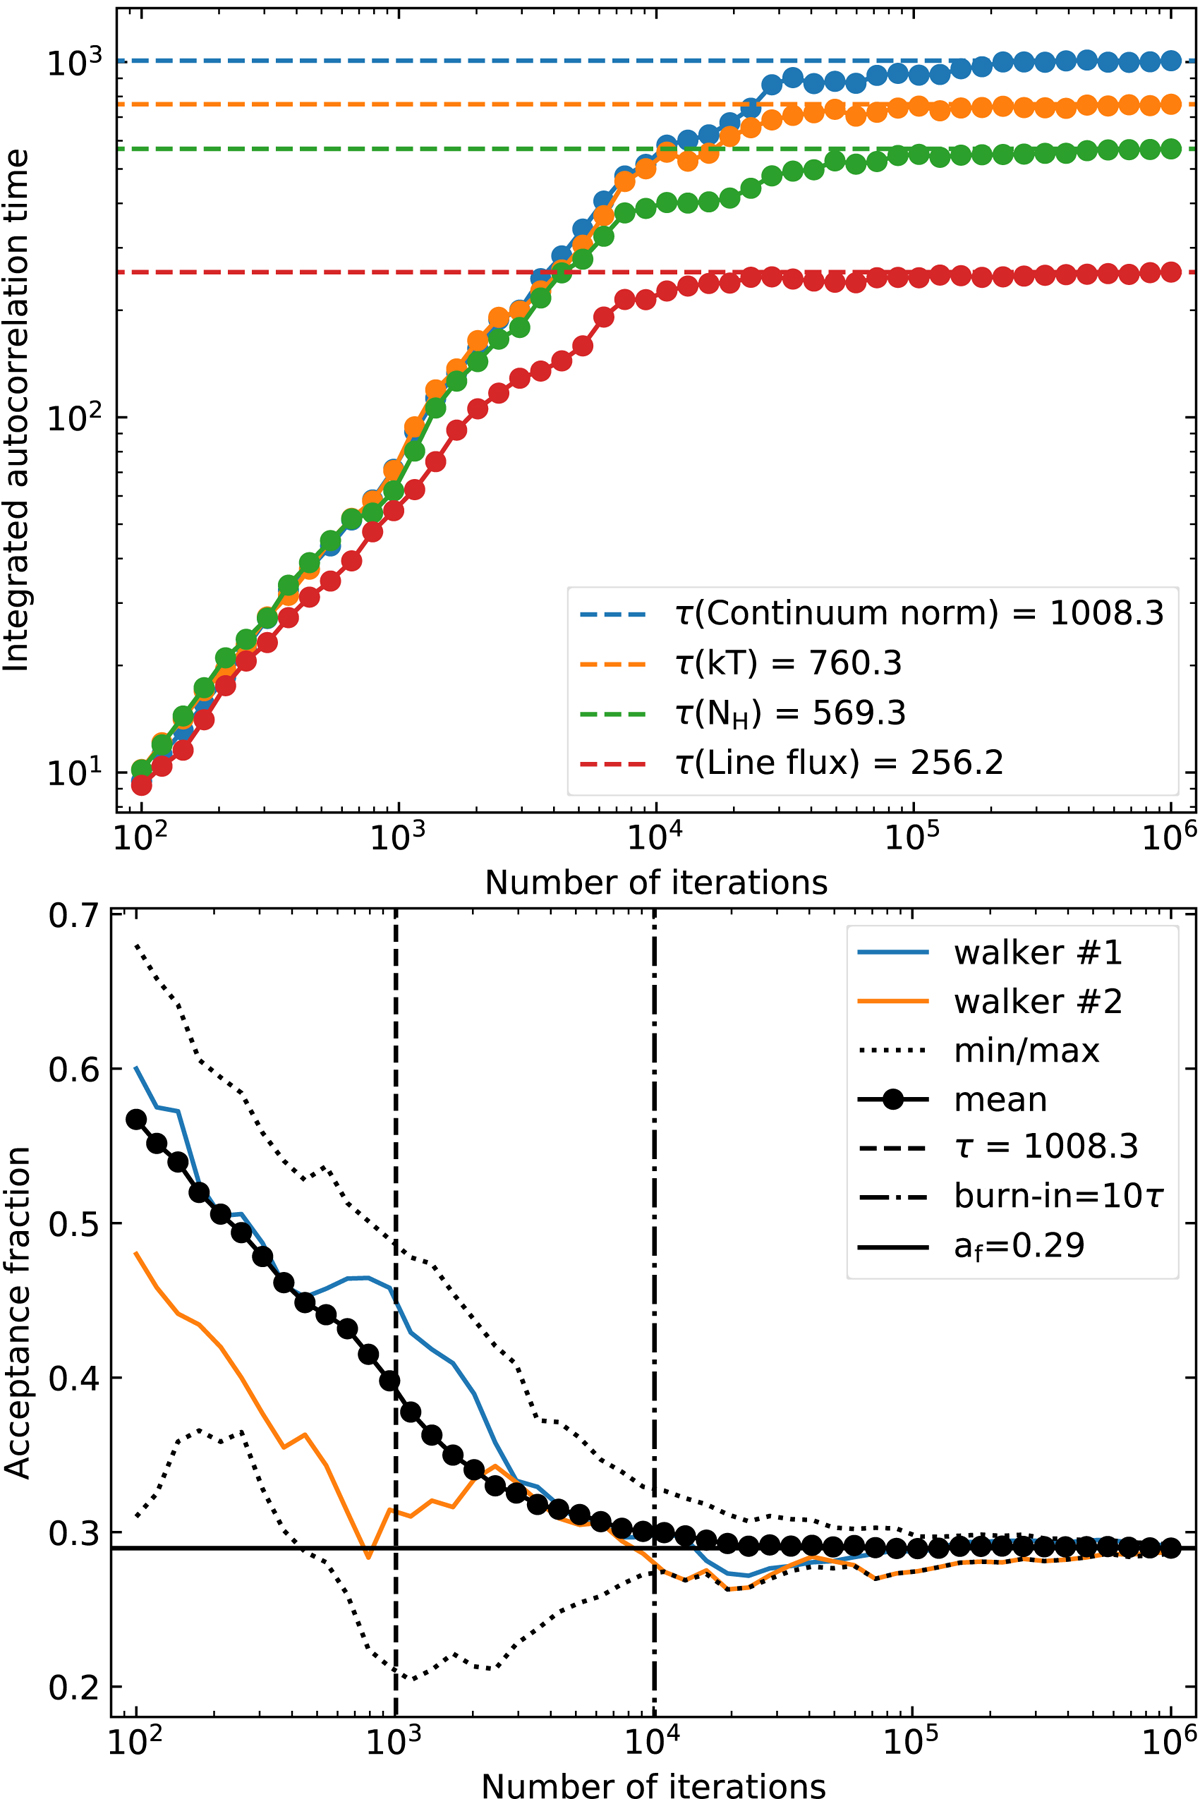
Burn-in phase of the MCMC samples. Top panel: estimator of the integrated autocorrelation time versus the number of iterations. The dashed horizontal lines are the integrated autocorrelation time in an iteration-number unit for the model parameters after 106 iterations with 46 walkers; the burn-in phase is lower than ten times the maximum of these values. Bottom panel: acceptance fraction versus the number of iterations. The mean of the walkers’ acceptance fractions (dotted line) converges after the burn-in phase.
Current usage metrics show cumulative count of Article Views (full-text article views including HTML views, PDF and ePub downloads, according to the available data) and Abstracts Views on Vision4Press platform.
Data correspond to usage on the plateform after 2015. The current usage metrics is available 48-96 hours after online publication and is updated daily on week days.
Initial download of the metrics may take a while.