Fig. C.1.
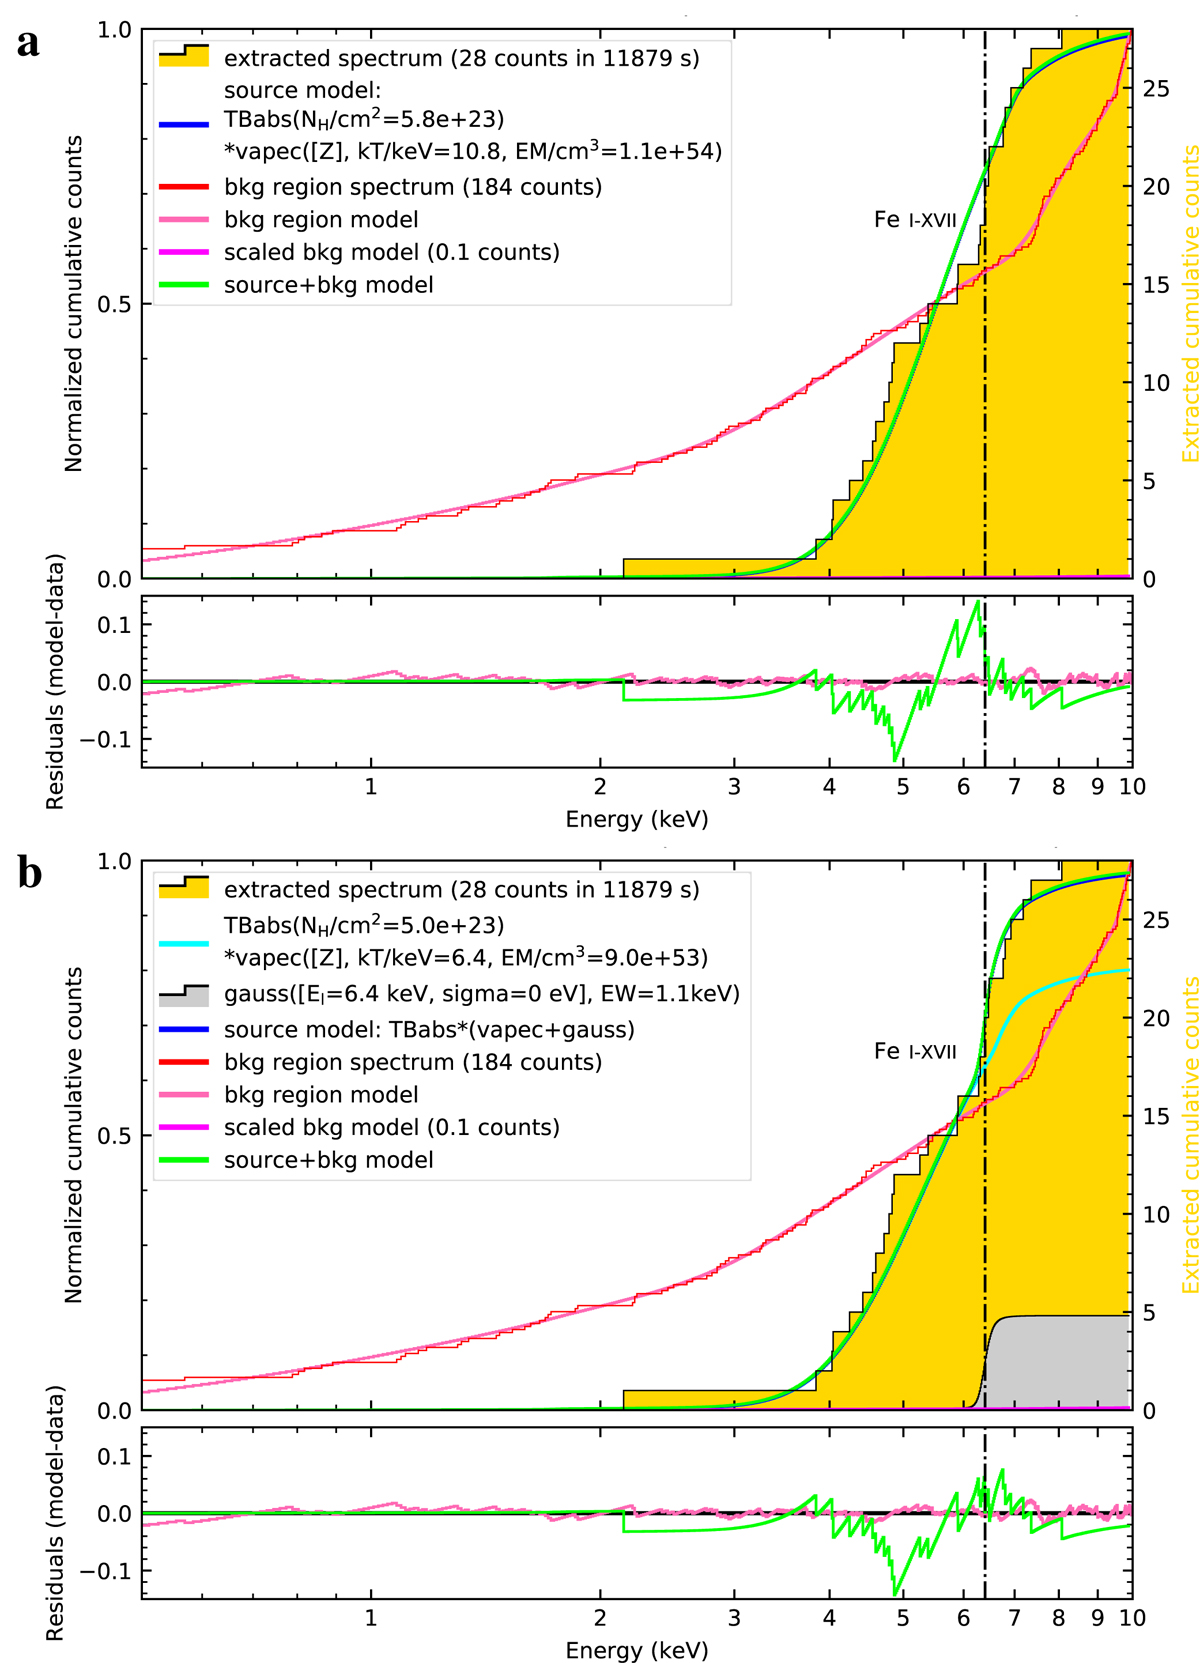
X-ray spectrum of HOPS 383 and background determination. Panels a and b: top panels: source-plus-background extracted cumulative spectrum (gold filled area) and XSPEC best-fit model (green), source model (blue), background region cumulative spectrum (orange) and model (red), and scaled background model (pink). The vertical dashed-dotted line is the energy of the 6.4 keV line arising from neutral or low-ionization iron. Bottom panels: model-minus-data residuals. Panel b: absorbed coronal thin emission (cyan) and 6.4 keV Gaussian emission line (silver filled area).
Current usage metrics show cumulative count of Article Views (full-text article views including HTML views, PDF and ePub downloads, according to the available data) and Abstracts Views on Vision4Press platform.
Data correspond to usage on the plateform after 2015. The current usage metrics is available 48-96 hours after online publication and is updated daily on week days.
Initial download of the metrics may take a while.