Fig. A.1.
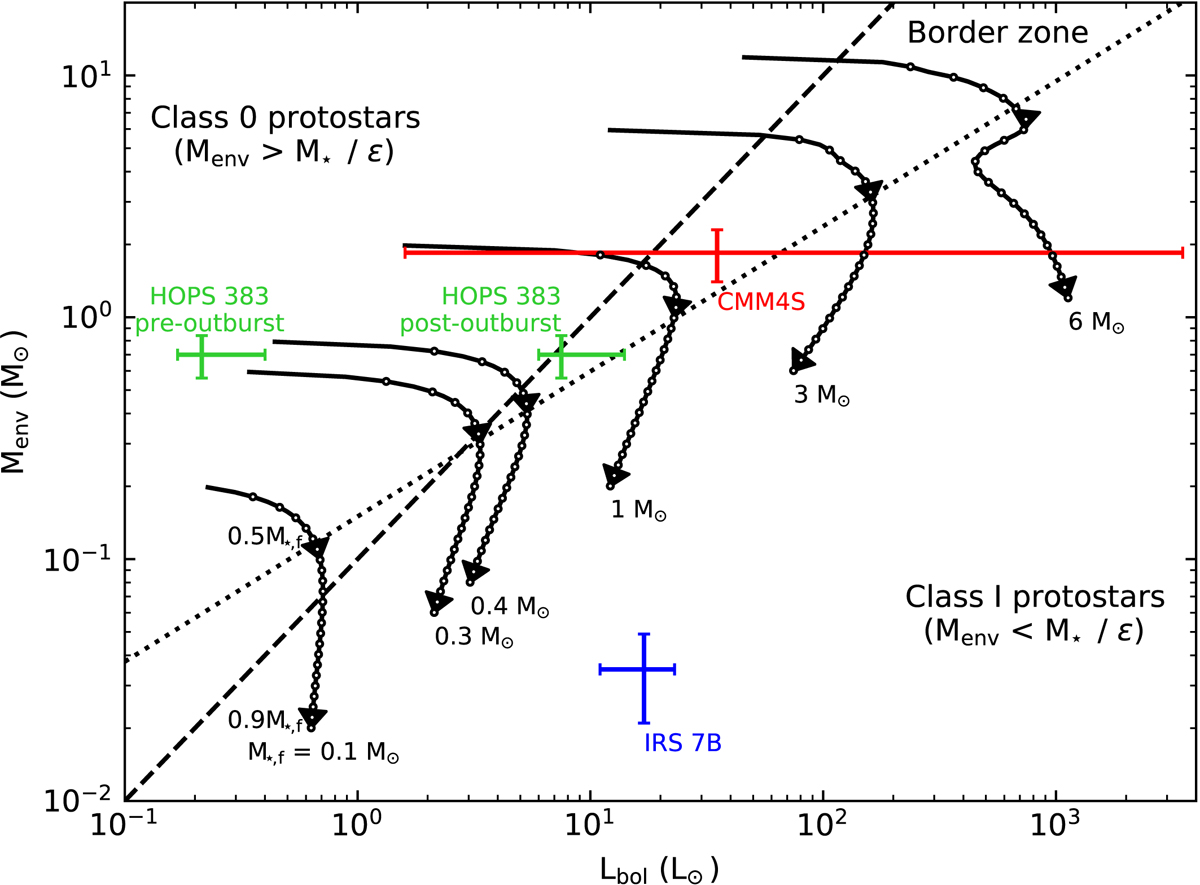
Envelope mass versus bolometric-luminosity diagram comparing the pre- and post-outburst positions of HOPS 383 (green data) with previously reported Class 0/I low-mass protostars detected in X-rays (blue and red data). The border zone between Class 0 (Menv > M⋆/ϵ, where ϵ = 0.5 is the local star-formation efficiency) and Class I (Menv < M⋆/ϵ) protostars is defined by Menv = 0.1 Lbol (constant accretion; dotted line) and ![]() (exponentially decaying accretion; dashed line). The protostellar evolutionary tracks are shown from 0.01 M⋆, f to 0.9 M⋆, f, where M⋆, f is the final stellar mass. The rising time along the tracks is indicated by white dots every 10 000 yr.
(exponentially decaying accretion; dashed line). The protostellar evolutionary tracks are shown from 0.01 M⋆, f to 0.9 M⋆, f, where M⋆, f is the final stellar mass. The rising time along the tracks is indicated by white dots every 10 000 yr.
Current usage metrics show cumulative count of Article Views (full-text article views including HTML views, PDF and ePub downloads, according to the available data) and Abstracts Views on Vision4Press platform.
Data correspond to usage on the plateform after 2015. The current usage metrics is available 48-96 hours after online publication and is updated daily on week days.
Initial download of the metrics may take a while.