Fig. 3.
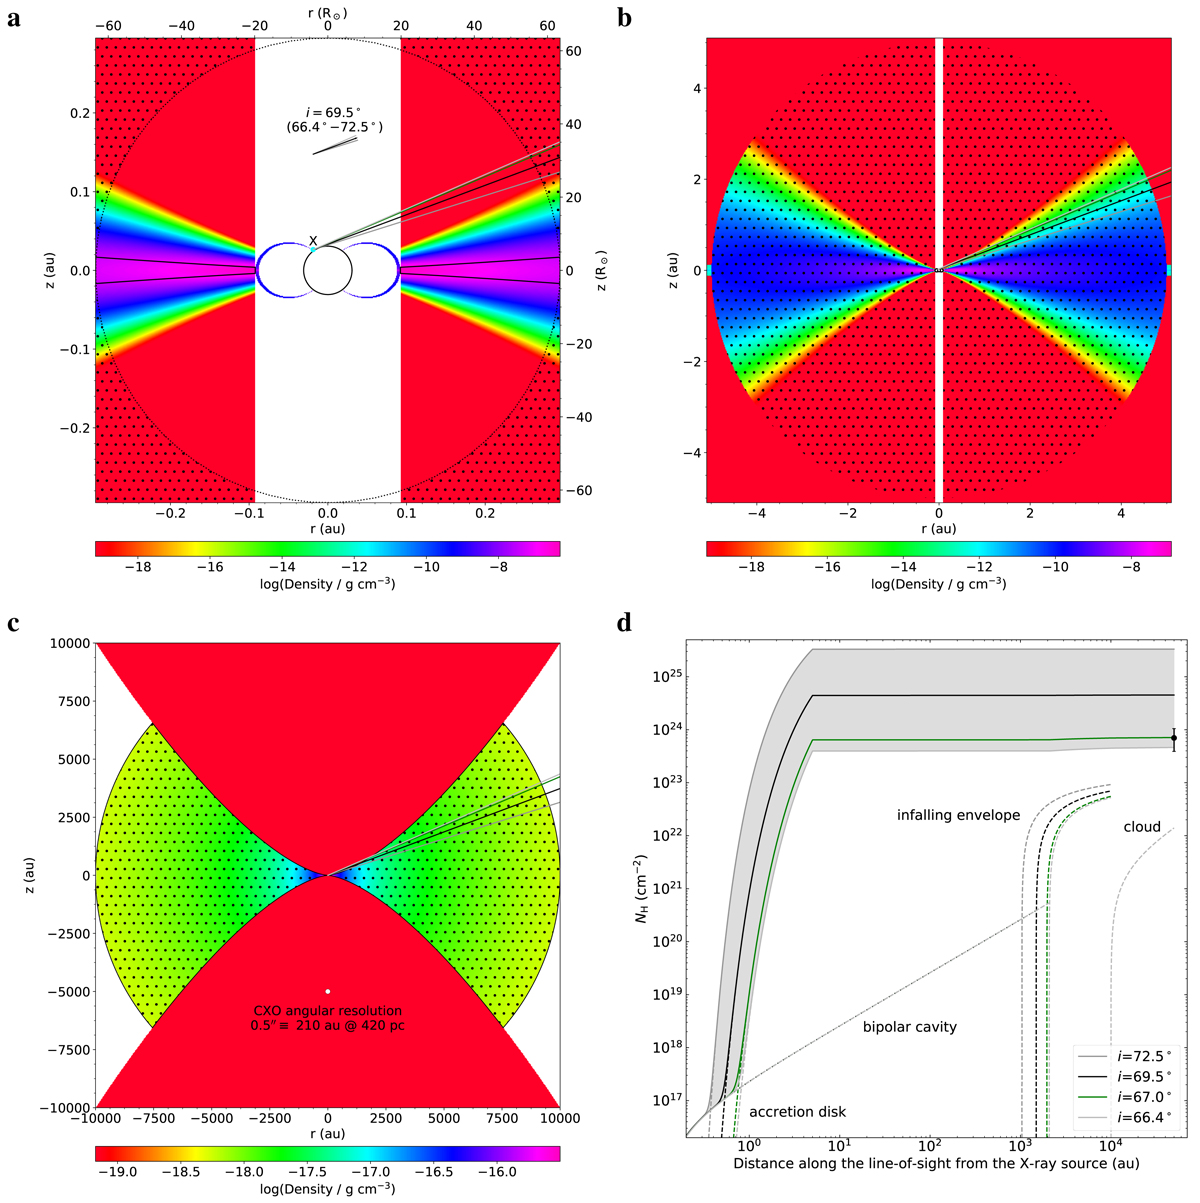
Probing the gas and dust toward HOPS 383 with the X-ray spectrum. Panels a–c: 2D density distribution from small to large spatial scales and viewing angle from the model of HOPS 383 (Furlan et al. 2016). Dots indicate regions with dust. Panel d: cumulative hydrogen column density along the line-of-sight from the X-ray source. The dashed lines show the contribution of the accretion disk, the bipolar cavity, the infalling envelope, and the cloud. The data point with an error bar (90% C.I.) is the hydrogen column density that we obtained from the X-ray spectrum modeling.
Current usage metrics show cumulative count of Article Views (full-text article views including HTML views, PDF and ePub downloads, according to the available data) and Abstracts Views on Vision4Press platform.
Data correspond to usage on the plateform after 2015. The current usage metrics is available 48-96 hours after online publication and is updated daily on week days.
Initial download of the metrics may take a while.