Fig. 2.
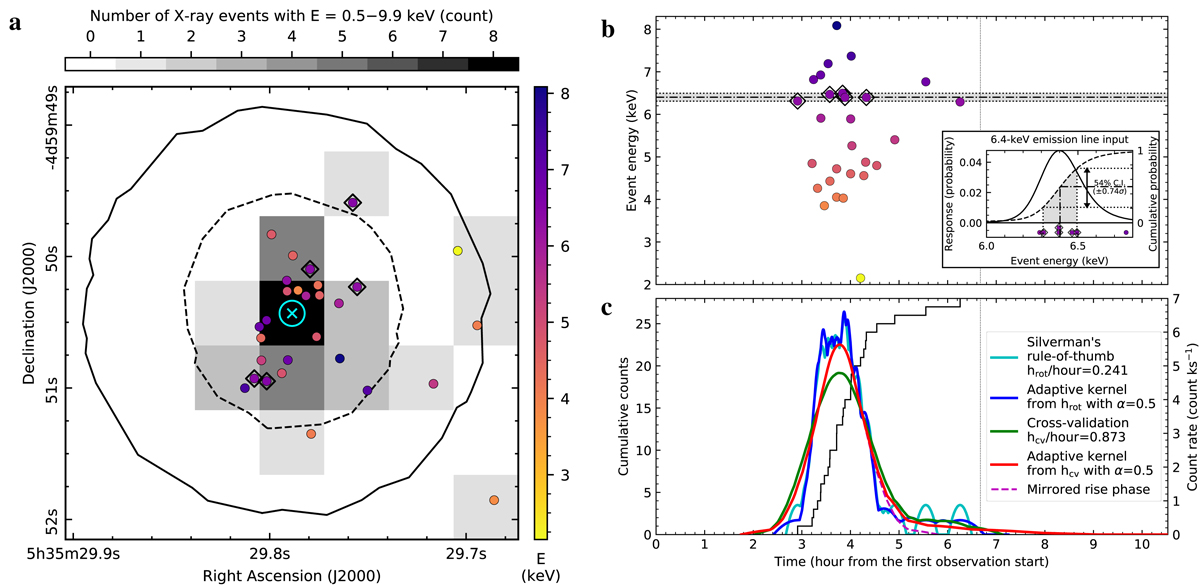
X-ray flare of HOPS 383. Panel a: sky position of the X-ray events detected during the Chandra observation on 2017 December 13. The cyan cross and circle are the X-ray position and positional error of HOPS 383, respectively. The dashed and solid contours encompass 90% (position determination) and 96% (spectrum extraction) of 1.49 keV point source emission, respectively. The diamonds mark the events from the 6.4 keV emission line. Panel b: event energy versus time of arrival. The gray stripe is centered at 6.4 keV and corresponds to a confidence interval of 54% centered at this emission line observed with ACIS-I (inset). Panel c: cumulative counts and various smoothed light curves. The dashed curve is the mirrored rise phase of the red curve. Panels b and c: the vertical dotted line at ∼6.7 h marks an exposure gap of 3.1 s.
Current usage metrics show cumulative count of Article Views (full-text article views including HTML views, PDF and ePub downloads, according to the available data) and Abstracts Views on Vision4Press platform.
Data correspond to usage on the plateform after 2015. The current usage metrics is available 48-96 hours after online publication and is updated daily on week days.
Initial download of the metrics may take a while.