Fig. 1.

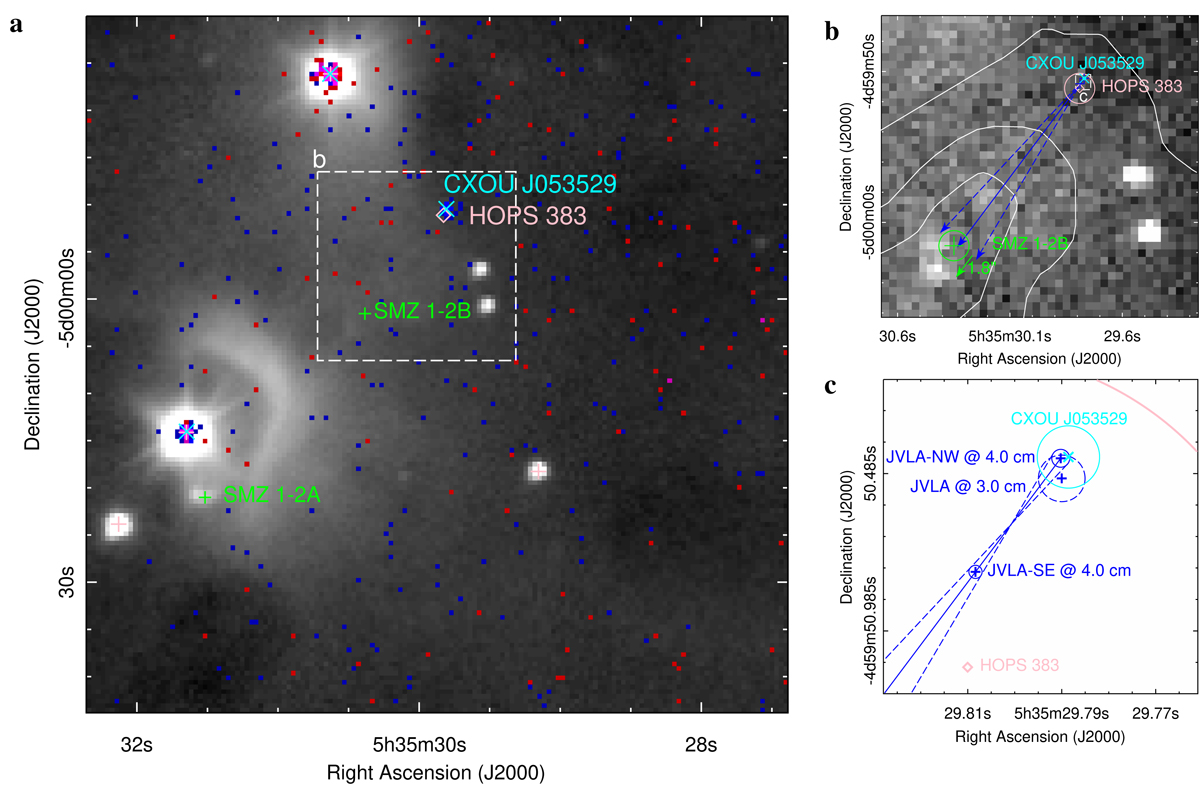
Chandra detection of HOPS 383. Panel a: the red and blue ![]() pixels display logarithmically the 0.5–2 keV and 2–7 keV X-rays, respectively, which were detected from 2017 December 13 to 14 during three ACIS-I exposures, totaling 83 877 s. The logarithmic grayscale K-band image was obtained on 2017 December 14 with the Spartan infrared camera on the SOAR telescope. North is up and east is left. The pink pluses and diamond, the green pluses, and cyan crosses are near- and mid-infrared sources (Megeath et al. 2012), H2-shocked emission (Stanke et al. 2002), and X-ray sources, respectively. The white dashed box shows the field-of-view of Fig. 1b. Panel b: Spartan H2-filter image obtained on 2017 December 14 in linear grayscale. The white contours show the 12CO blueshifted outflow of HOPS 383 (Feddersen et al. 2020). The blue pluses are radio sources (Galván-Madrid et al. 2015; Rodríguez et al. 2017). The blue and green arrows show the direction of the thermal-jet candidate and the proper motion of the H2 emission knot SMZ 1-2B, respectively. The white dashed box shows the field-of-view of Fig. 1c. Panel c: enlargement around HOPS 383 shows the mid-infrared (pink), radio (blue), and X-ray (cyan) positional error circles.
pixels display logarithmically the 0.5–2 keV and 2–7 keV X-rays, respectively, which were detected from 2017 December 13 to 14 during three ACIS-I exposures, totaling 83 877 s. The logarithmic grayscale K-band image was obtained on 2017 December 14 with the Spartan infrared camera on the SOAR telescope. North is up and east is left. The pink pluses and diamond, the green pluses, and cyan crosses are near- and mid-infrared sources (Megeath et al. 2012), H2-shocked emission (Stanke et al. 2002), and X-ray sources, respectively. The white dashed box shows the field-of-view of Fig. 1b. Panel b: Spartan H2-filter image obtained on 2017 December 14 in linear grayscale. The white contours show the 12CO blueshifted outflow of HOPS 383 (Feddersen et al. 2020). The blue pluses are radio sources (Galván-Madrid et al. 2015; Rodríguez et al. 2017). The blue and green arrows show the direction of the thermal-jet candidate and the proper motion of the H2 emission knot SMZ 1-2B, respectively. The white dashed box shows the field-of-view of Fig. 1c. Panel c: enlargement around HOPS 383 shows the mid-infrared (pink), radio (blue), and X-ray (cyan) positional error circles.
Current usage metrics show cumulative count of Article Views (full-text article views including HTML views, PDF and ePub downloads, according to the available data) and Abstracts Views on Vision4Press platform.
Data correspond to usage on the plateform after 2015. The current usage metrics is available 48-96 hours after online publication and is updated daily on week days.
Initial download of the metrics may take a while.


