Fig. 5.
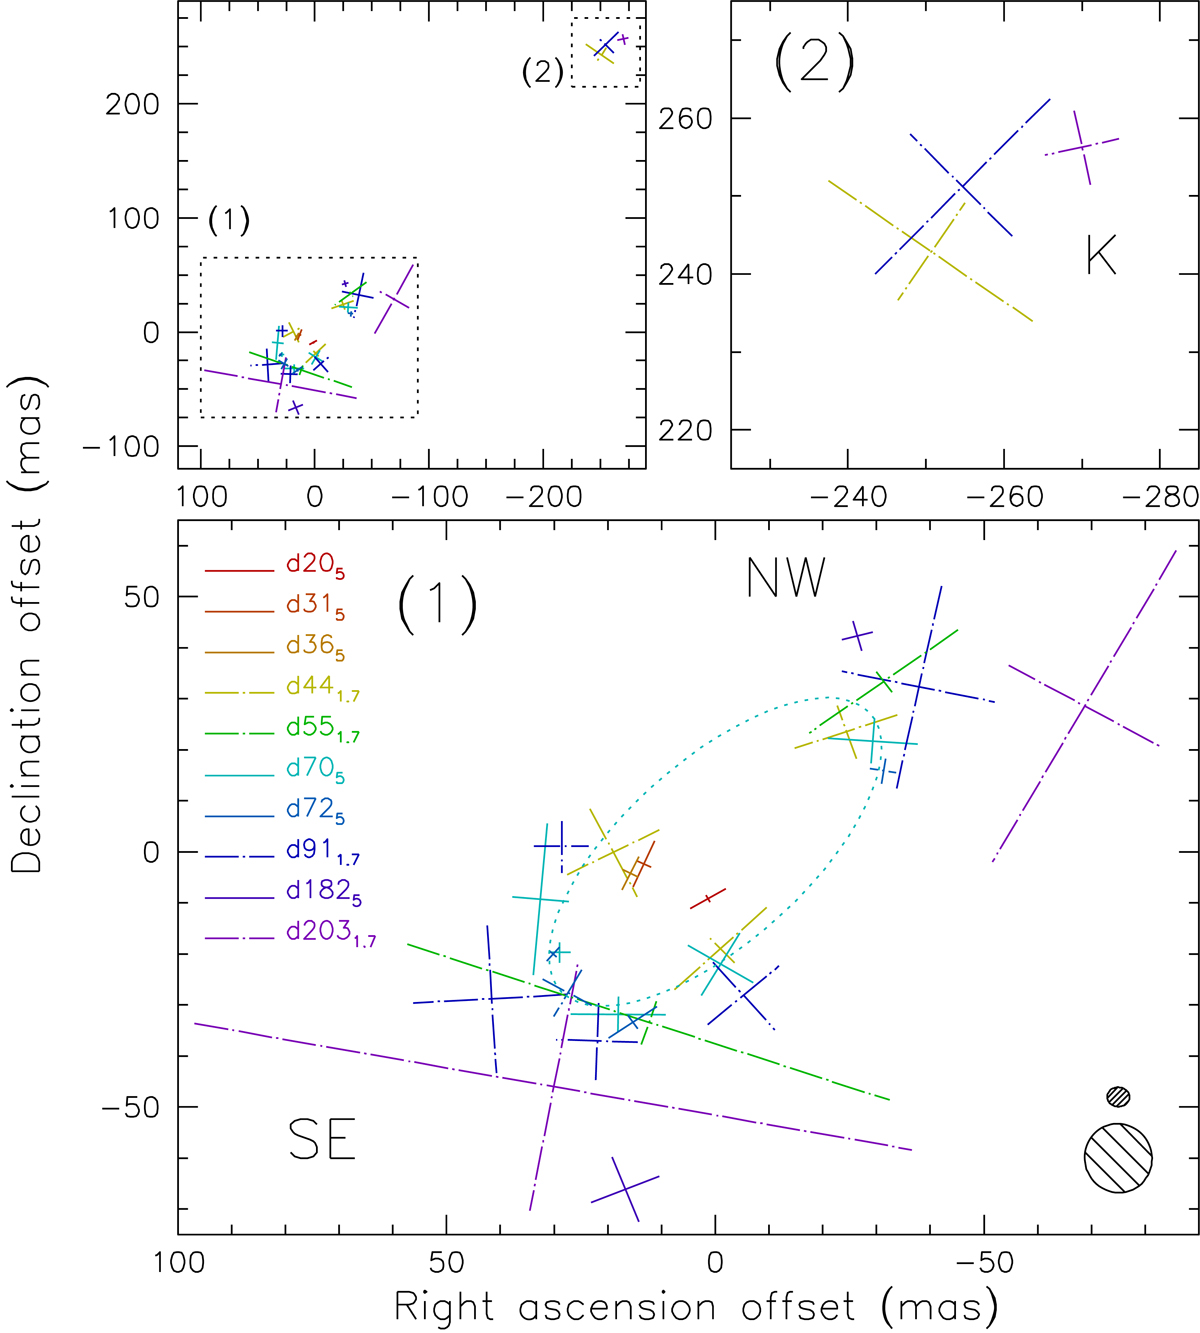
Model-fit components. Top left: entire field; top right: zoom in the outer component region; and bottom: zoom in the central shell region. The crosses indicates the position, size, and orientation of the model-fit Gaussian components. The solid and dot-dashed lines represent 5 GHz and 1.6 GHz observations, respectively. The different colours show different epochs as described in the legend; the subscript indicates the observing frequency. The dotted curve shows the best-fit ellipse to the set of components at day 70. The reference position for all fields is at RA 21h 02m 09.81700s, Dec. +45° 46′ 32″.68253. The hatched (almost circular) ellipses in the bottom right corner show the HPBW at 1.6 GHz (from day 91) and 5 GHz (from day 70), for reference.
Current usage metrics show cumulative count of Article Views (full-text article views including HTML views, PDF and ePub downloads, according to the available data) and Abstracts Views on Vision4Press platform.
Data correspond to usage on the plateform after 2015. The current usage metrics is available 48-96 hours after online publication and is updated daily on week days.
Initial download of the metrics may take a while.