Fig. 3.
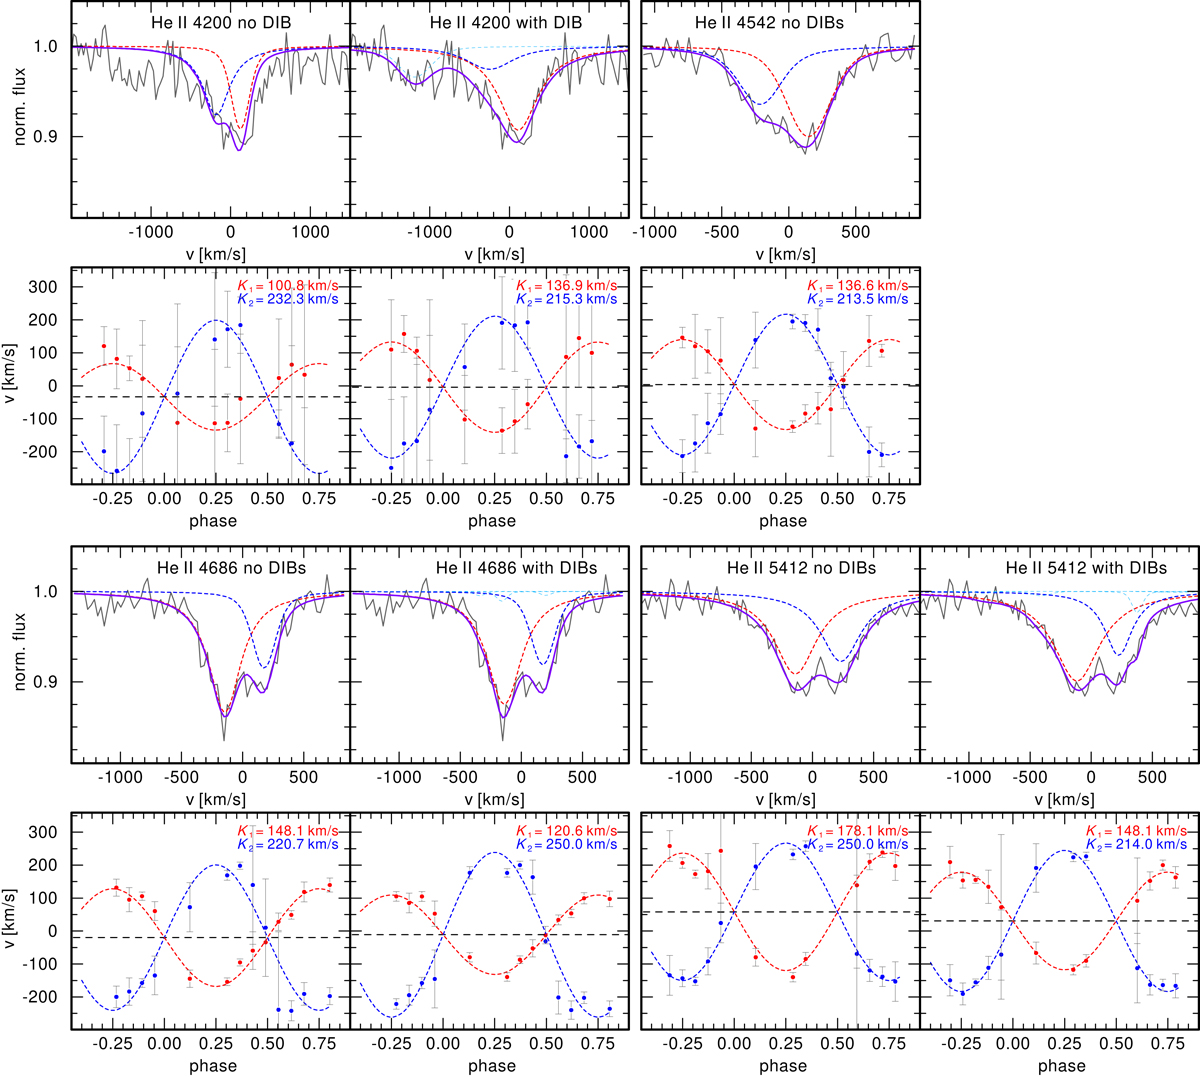
Examples of Voigt profile fits (blue: secondary, red: primary, light blue: DIBs, purple: combined fit) to the four observed He II lines (gray). Top panels: observation #2 taken around phase −0.25, bottom panels: observation #7 taken around phase 0.28. RV curves (blue: secondary, red: primary) obtained for the respective He II lines with the RV amplitudes are shown below. The black, dashed line in RV curve plots indicates the system velocity.
Current usage metrics show cumulative count of Article Views (full-text article views including HTML views, PDF and ePub downloads, according to the available data) and Abstracts Views on Vision4Press platform.
Data correspond to usage on the plateform after 2015. The current usage metrics is available 48-96 hours after online publication and is updated daily on week days.
Initial download of the metrics may take a while.