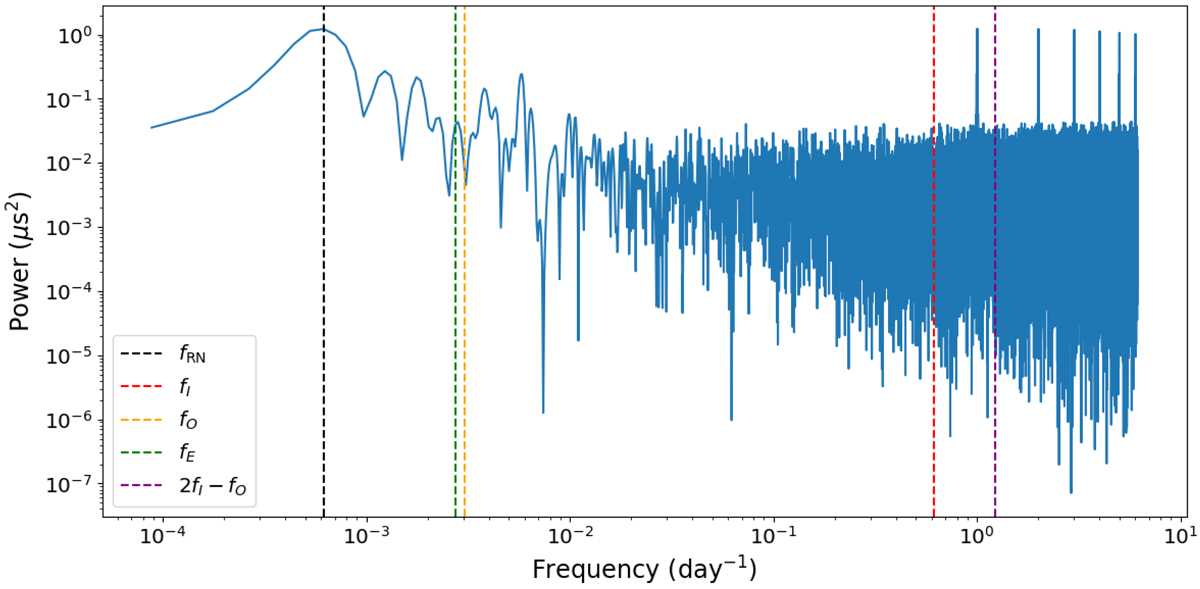
Fig. 4.

Lomb-Scargle periodogram of the timing residuals for the solution of Table 1. The periodogram is sampled at fm/5 where fm ≃ 2268 days−1 is the inverse of the full time span. From left to right vertical lines show the frequencies of the red-noise component (fRN ≃ 1650 day−1, black), the Earth orbital period (fE, green), the outer-orbit orbital period (fO, orange), the inner-binary orbital period (fI, red) and the SEP violation signature (2fI − fO, purple).
Current usage metrics show cumulative count of Article Views (full-text article views including HTML views, PDF and ePub downloads, according to the available data) and Abstracts Views on Vision4Press platform.
Data correspond to usage on the plateform after 2015. The current usage metrics is available 48-96 hours after online publication and is updated daily on week days.
Initial download of the metrics may take a while.


