Fig. 4.
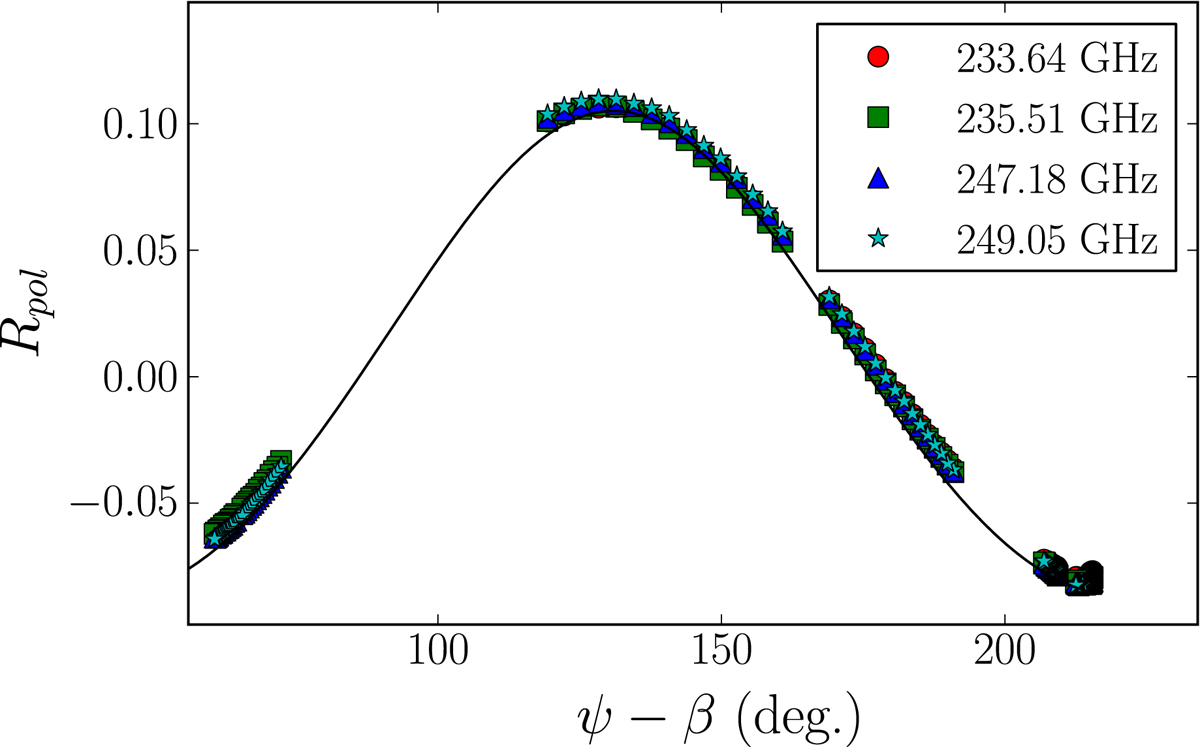
Differential polarimetry, Rpol, between NE and SW as a function of the parallactic angle, ψ, rotated to the antenna feed, β (see Eqs. (13) to (16) in Martí-Vidal et al. 2016). The thick line is the Rpol prediction from the full-polarization image (i.e., the image shown in Fig. 1), assuming no Faraday rotation. Notice that the Rpol values are similar for all frequencies.
Current usage metrics show cumulative count of Article Views (full-text article views including HTML views, PDF and ePub downloads, according to the available data) and Abstracts Views on Vision4Press platform.
Data correspond to usage on the plateform after 2015. The current usage metrics is available 48-96 hours after online publication and is updated daily on week days.
Initial download of the metrics may take a while.