Free Access
Fig. 2.
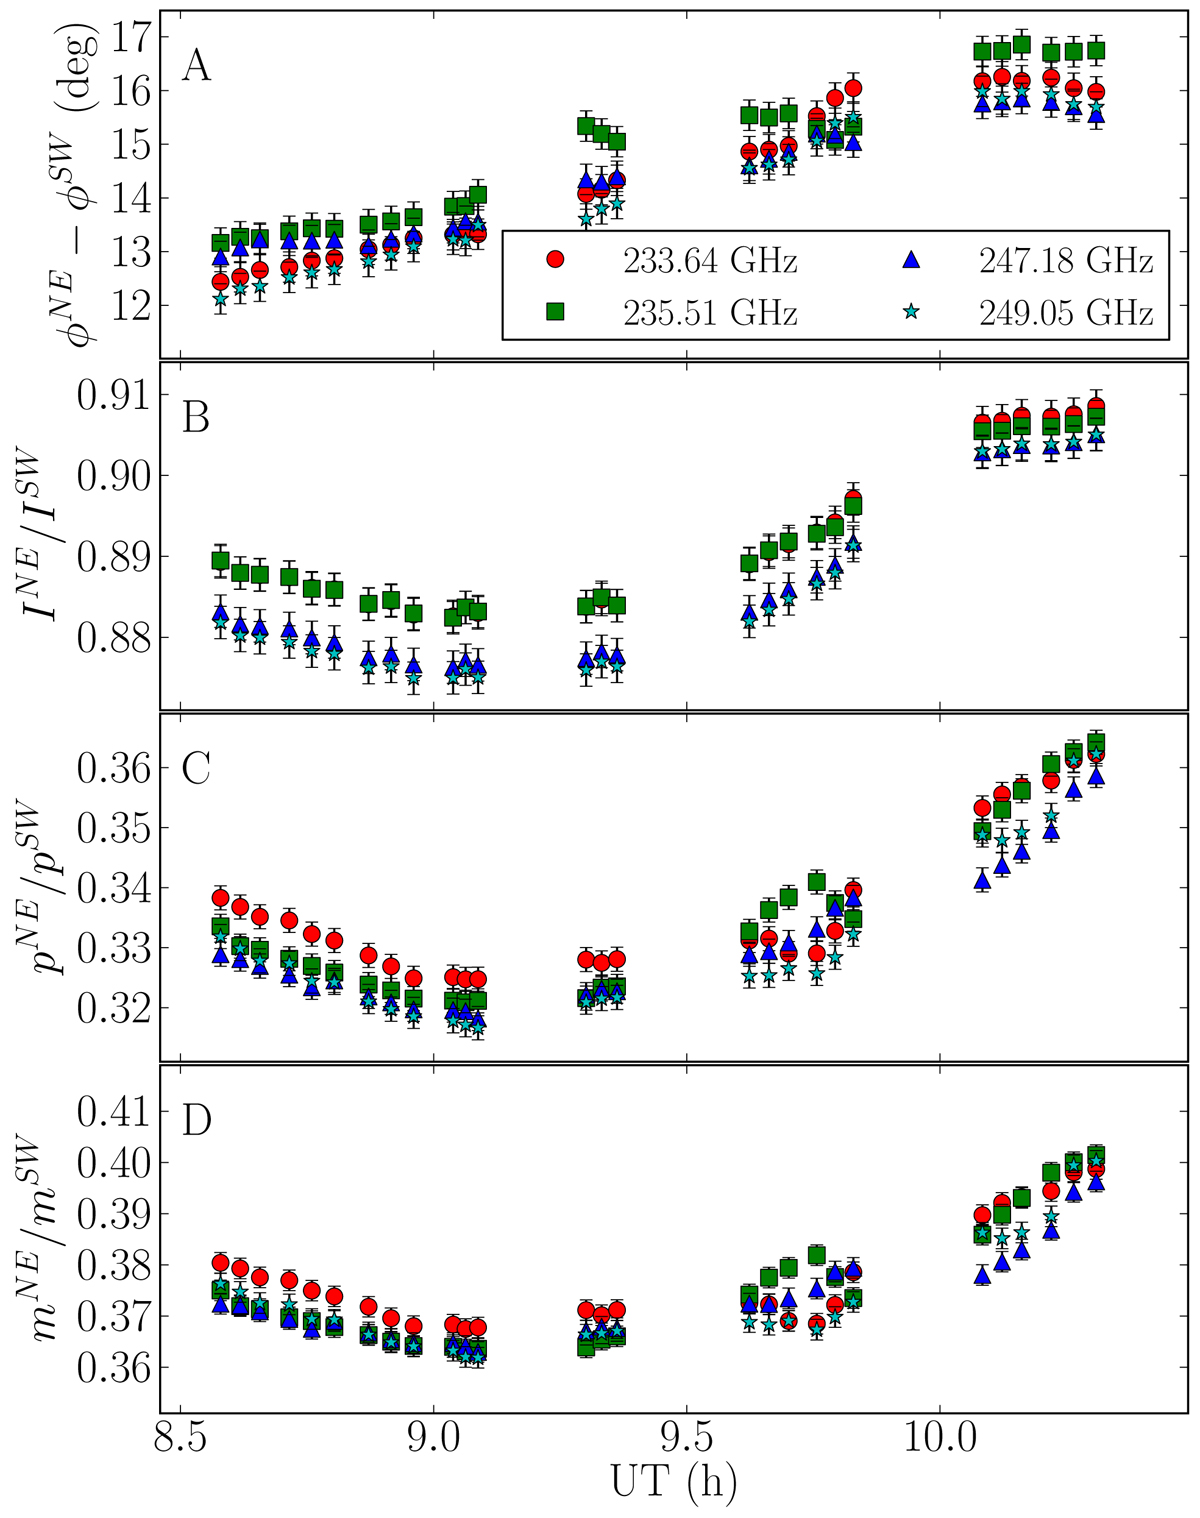
Intra-observation evolution of the EVPA difference between the NE and SW images (A), ratio of total intensity of NE to SW (B), ratio of linear polarization intensity (C) and of fractional polarization (D). Each spectral window is shown with a different symbol and color.
Current usage metrics show cumulative count of Article Views (full-text article views including HTML views, PDF and ePub downloads, according to the available data) and Abstracts Views on Vision4Press platform.
Data correspond to usage on the plateform after 2015. The current usage metrics is available 48-96 hours after online publication and is updated daily on week days.
Initial download of the metrics may take a while.