Fig. 1.
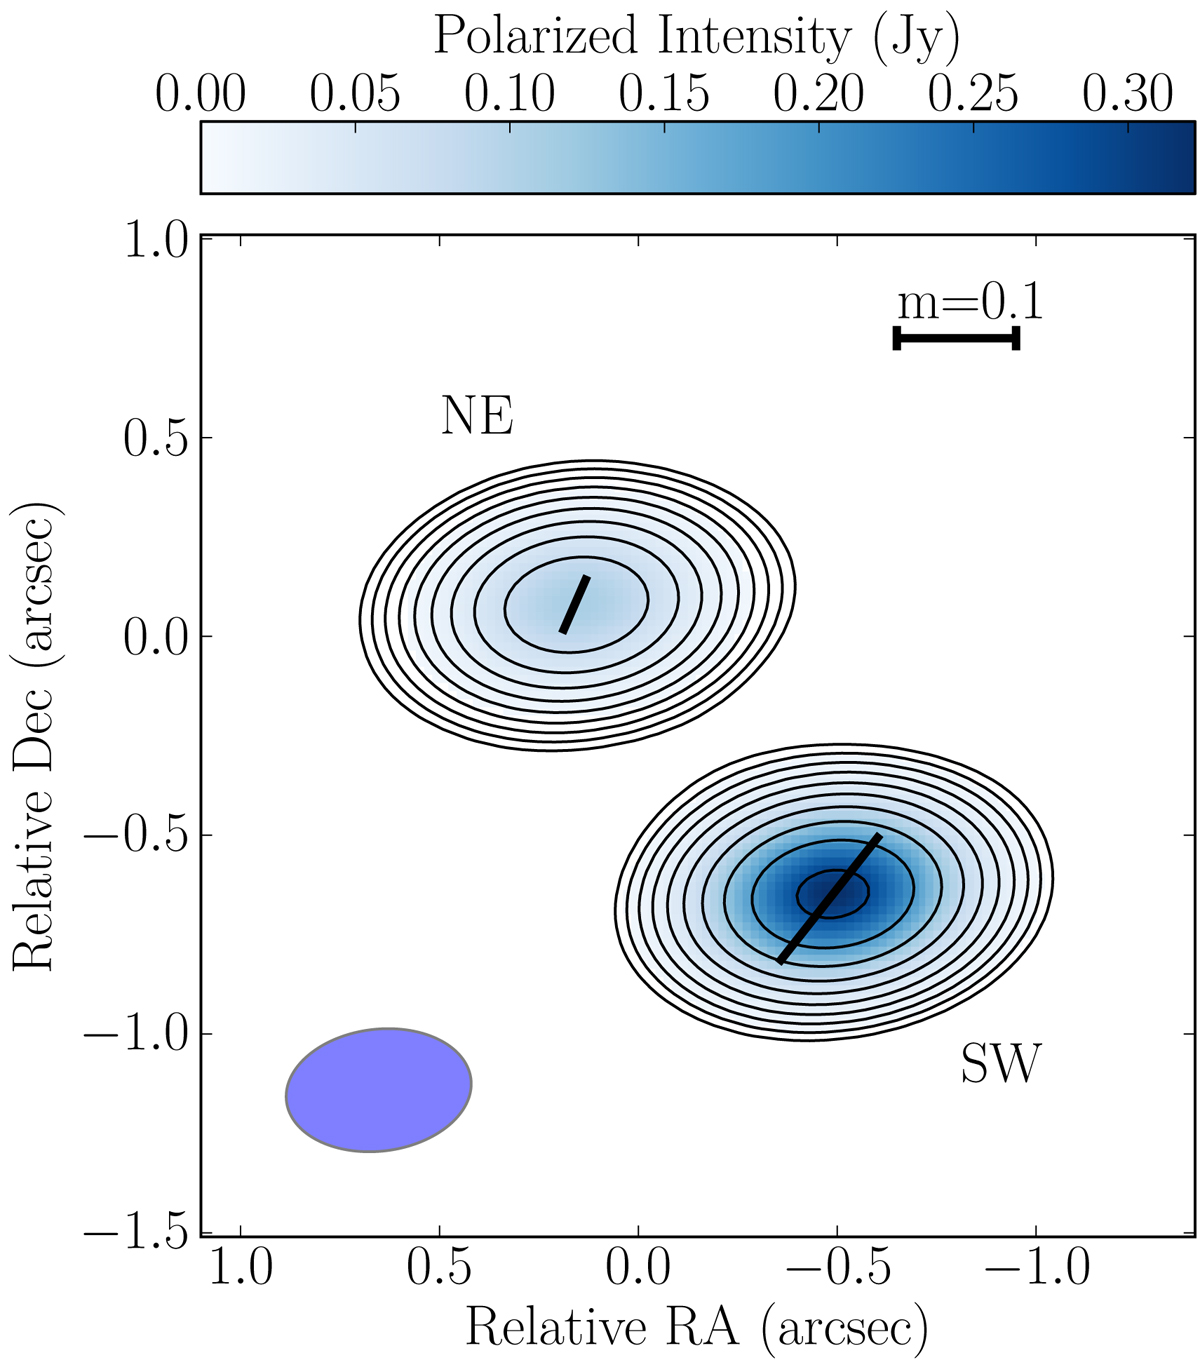
ALMA band 6 full-polarization image of PKS 1830−211. Contours represent Stokes I and are given in logarithmic scale, running from 2% to 90% of the peak intensity (2.34 Jy beam−1); the polarized intensity is color-coded (see scale at top); the thick lines represent the EVPA, with lengths proportional to fractional polarization (the peak of 14% is located at the SW image). The scale of the fractional polarization, m, is given by the line in the top right corner; the full width at half maximum of the CLEAN beam is shown in the bottom left corner.
Current usage metrics show cumulative count of Article Views (full-text article views including HTML views, PDF and ePub downloads, according to the available data) and Abstracts Views on Vision4Press platform.
Data correspond to usage on the plateform after 2015. The current usage metrics is available 48-96 hours after online publication and is updated daily on week days.
Initial download of the metrics may take a while.