Fig. 8.
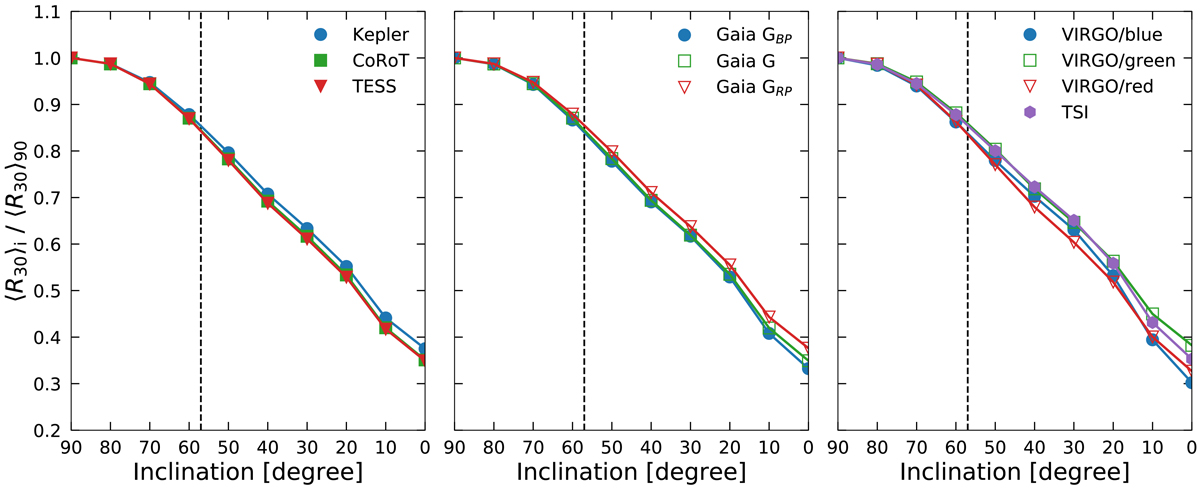
Dependence of the mean variability in R30 on the inclination (termed ⟨R30⟩i, where i stands for the inclination). All values have been normalised to the respective equator-on (i = 90°) value, here called ⟨R30⟩90. Individual curves represent different filter systems. Left panel: Kepler, TESS, and CoRoT. Middle panel: three Gaia filters. Right panel: three VIRGO filters and the TSI. The vertical dashed black line indicates an inclination of 57°.
Current usage metrics show cumulative count of Article Views (full-text article views including HTML views, PDF and ePub downloads, according to the available data) and Abstracts Views on Vision4Press platform.
Data correspond to usage on the plateform after 2015. The current usage metrics is available 48-96 hours after online publication and is updated daily on week days.
Initial download of the metrics may take a while.