Fig. 7.
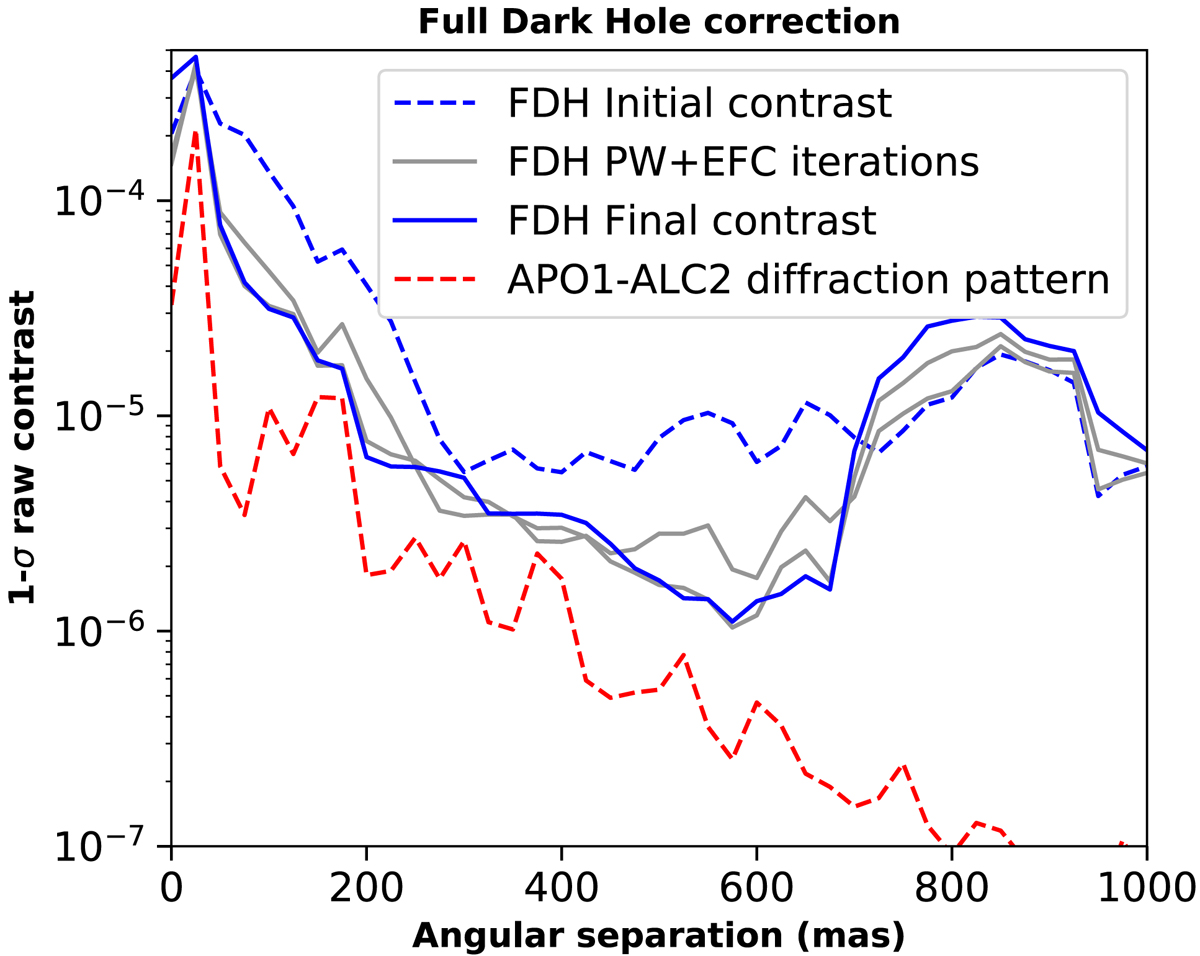
Experimental data: contrast rms during the different iterations of PW+EFC implemented with the SPHERE calibration unit in a FDH of size 31λ/D × 31λ/D (in gray). The curve before compensation is plotted with a blue dashed line; the contrast after the last iteration is represented by a blue continuous line. The theoretical limit set by the APLC diffraction pattern is plotted with a red dashed line.
Current usage metrics show cumulative count of Article Views (full-text article views including HTML views, PDF and ePub downloads, according to the available data) and Abstracts Views on Vision4Press platform.
Data correspond to usage on the plateform after 2015. The current usage metrics is available 48-96 hours after online publication and is updated daily on week days.
Initial download of the metrics may take a while.