Fig. 6.
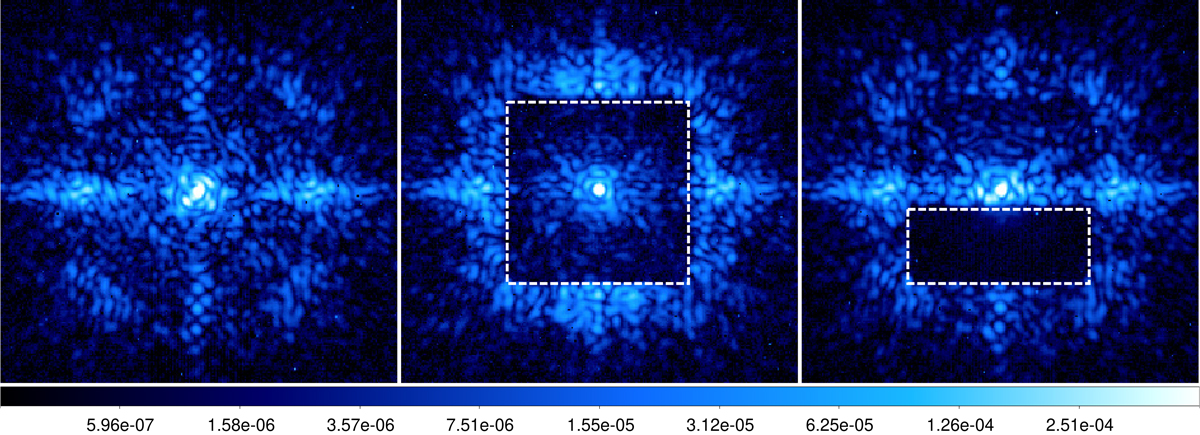
Experimental data: coronagraphic images recorded with SPHERE calibration unit in the H3 band before any NCPA compensation, after 2 iterations of PW+EFC in a FDH (center), and after 6 iterations of PW+EFC in a HDH (right). The sizes of the FDH and HDH are, respectively, 31λ/D × 31λ/D and 13λ/D × 31λ/D, 1λ/D being equal to ∼43 mas. The HDH starts at 2.85λ/D from the optical axis to get as close as possible from the FPM bottom edge whose radius is 92.5 mas or about 2.15λ/D. The aim is to ensure the stability in the PW+EFC closed loop. The edges of each DH are represented in white dashed lines. The images were normalized by the maximum of the off-axis PSF, recorded at the first iteration of the PW+EFC process.
Current usage metrics show cumulative count of Article Views (full-text article views including HTML views, PDF and ePub downloads, according to the available data) and Abstracts Views on Vision4Press platform.
Data correspond to usage on the plateform after 2015. The current usage metrics is available 48-96 hours after online publication and is updated daily on week days.
Initial download of the metrics may take a while.