Open Access
Fig. 5.
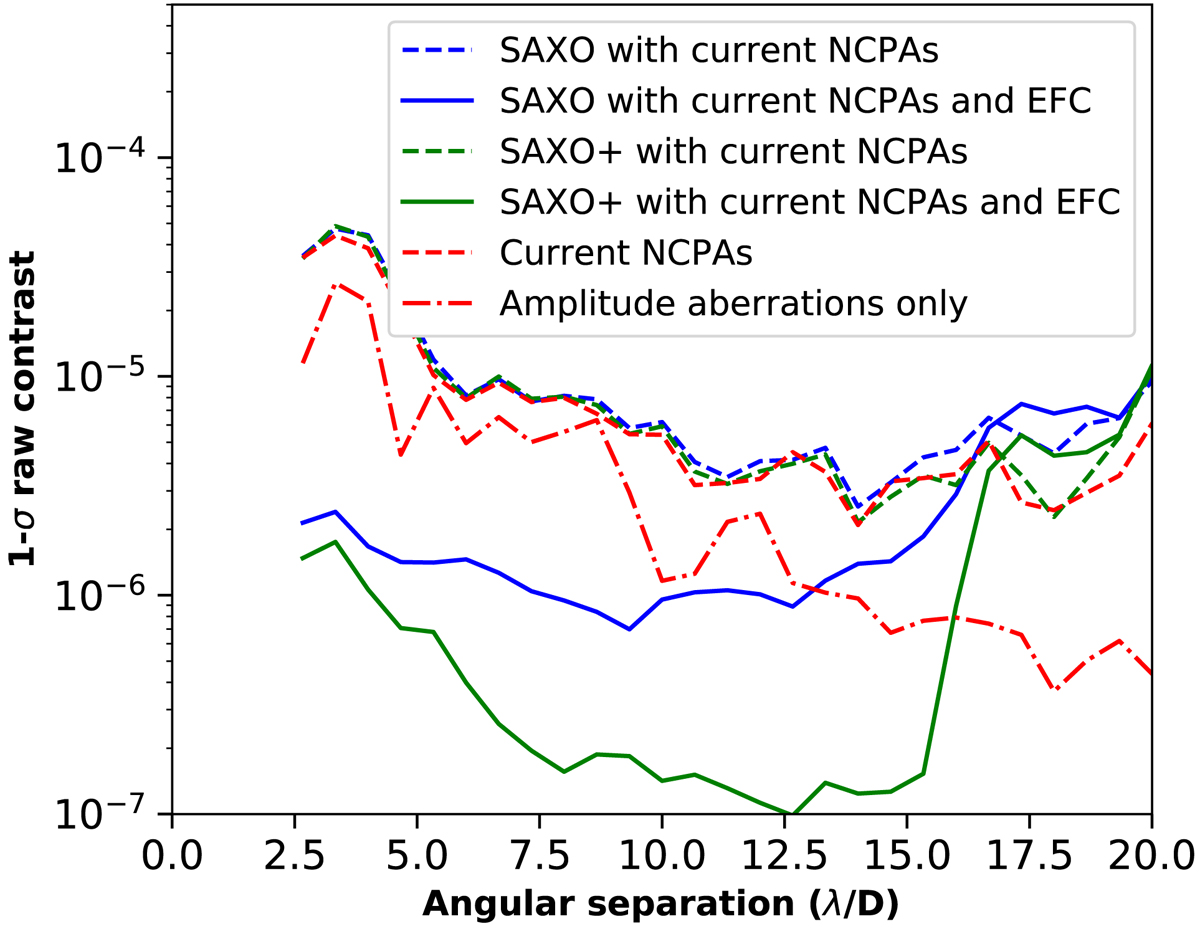
Numerical simulations: 1σ contrast as a function of the angular separation. The contrast is computed in the HDH region in each simulated configuration: with the current SAXO residuals or an upgraded SAXO+ residuals (dashed lines), with and without the EFC phase optimization (solid lines).
Current usage metrics show cumulative count of Article Views (full-text article views including HTML views, PDF and ePub downloads, according to the available data) and Abstracts Views on Vision4Press platform.
Data correspond to usage on the plateform after 2015. The current usage metrics is available 48-96 hours after online publication and is updated daily on week days.
Initial download of the metrics may take a while.