Fig. 4.
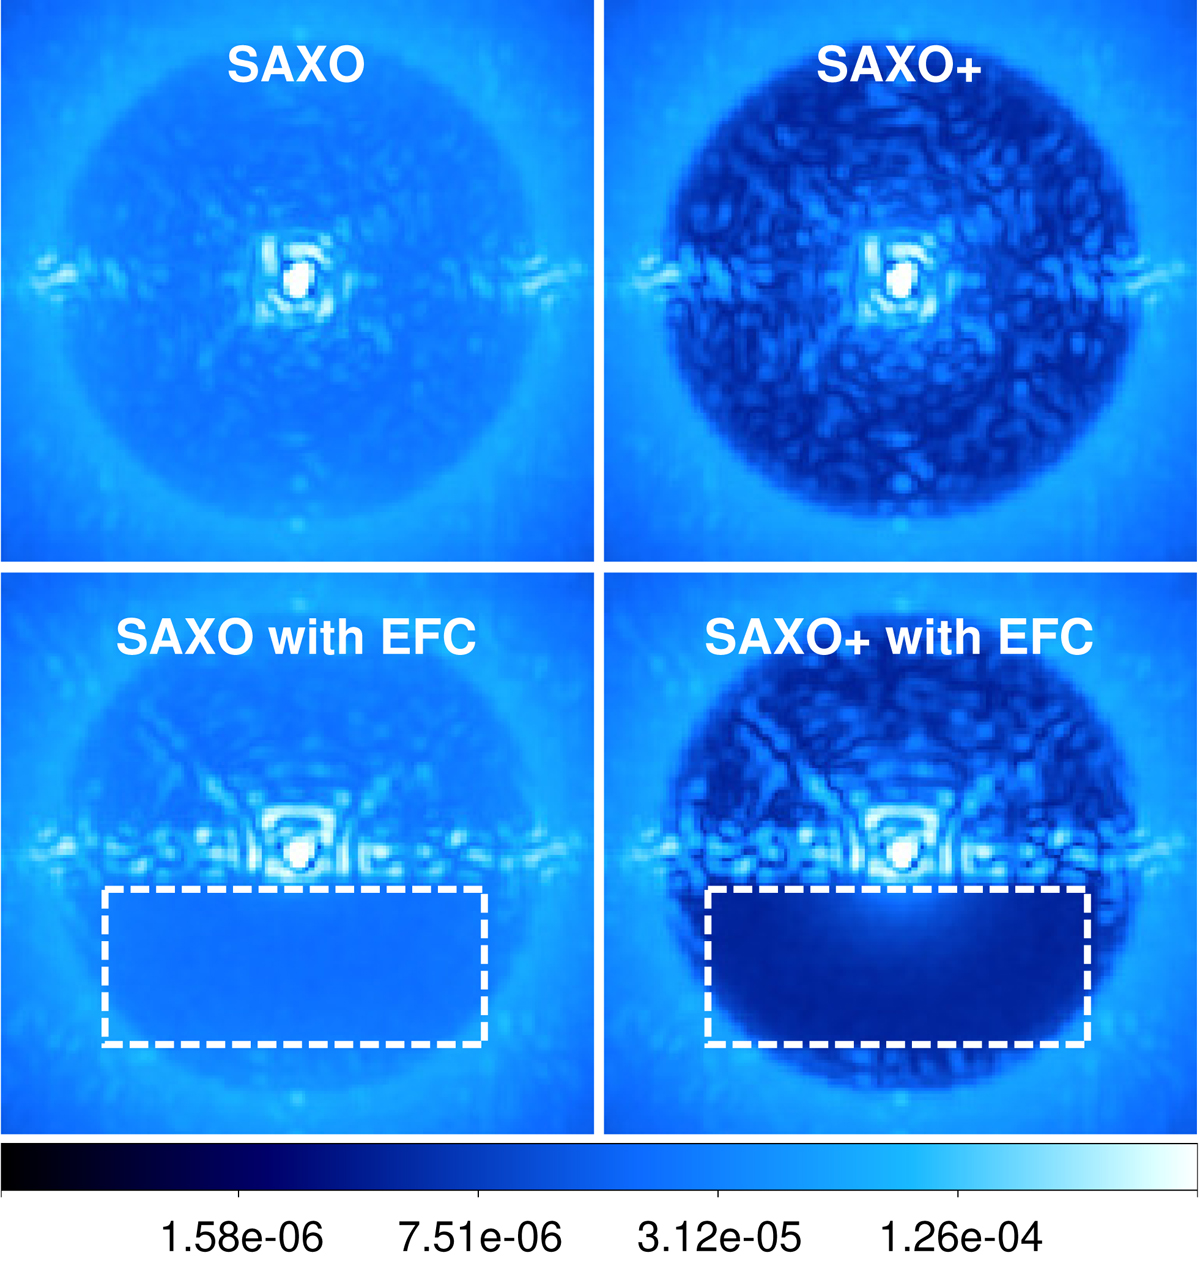
Numerical simulations: final coronagraphic images accounting for AO residuals from the current AO system, SAXO (left) and for AO residuals with a faster AO system, SAXO+ (right). Images on the top row are obtained with the APLC alone, while images on the bottom row are obtained after minimization of the stellar speckle intensity using PW+EFC. The HDH region is delimited by the white dashed rectangular box.
Current usage metrics show cumulative count of Article Views (full-text article views including HTML views, PDF and ePub downloads, according to the available data) and Abstracts Views on Vision4Press platform.
Data correspond to usage on the plateform after 2015. The current usage metrics is available 48-96 hours after online publication and is updated daily on week days.
Initial download of the metrics may take a while.