Fig. 9
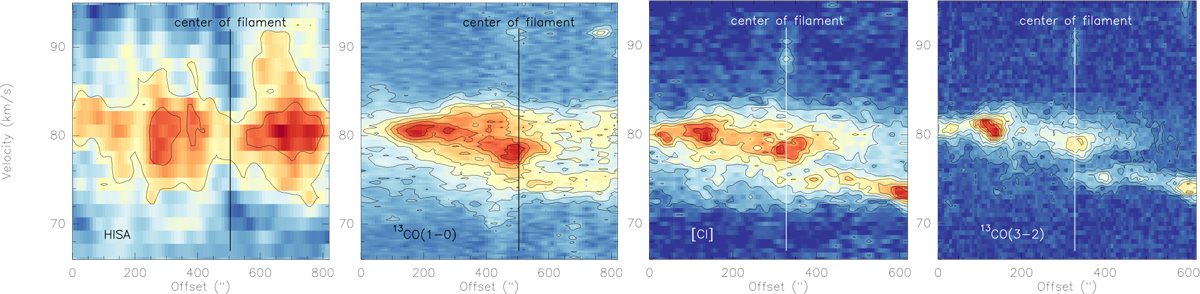
Position-velocity diagrams for the four tracers from left to right: HISA, 13CO(1–0), [CI], and 13CO(3–2). The cutsare in a north–south direction along the lines shown in Figs. 6 ([CI], 13CO(3–2)) and 10 (HISA, 13CO(1–0)). Both axes have a slightly larger extent for the HISA and 13CO(1–0) data compared to the [CI] and 13CO(3–2) cuts. The approximate location of the center of the filament is marked in all panels.
Current usage metrics show cumulative count of Article Views (full-text article views including HTML views, PDF and ePub downloads, according to the available data) and Abstracts Views on Vision4Press platform.
Data correspond to usage on the plateform after 2015. The current usage metrics is available 48-96 hours after online publication and is updated daily on week days.
Initial download of the metrics may take a while.