Fig. 6
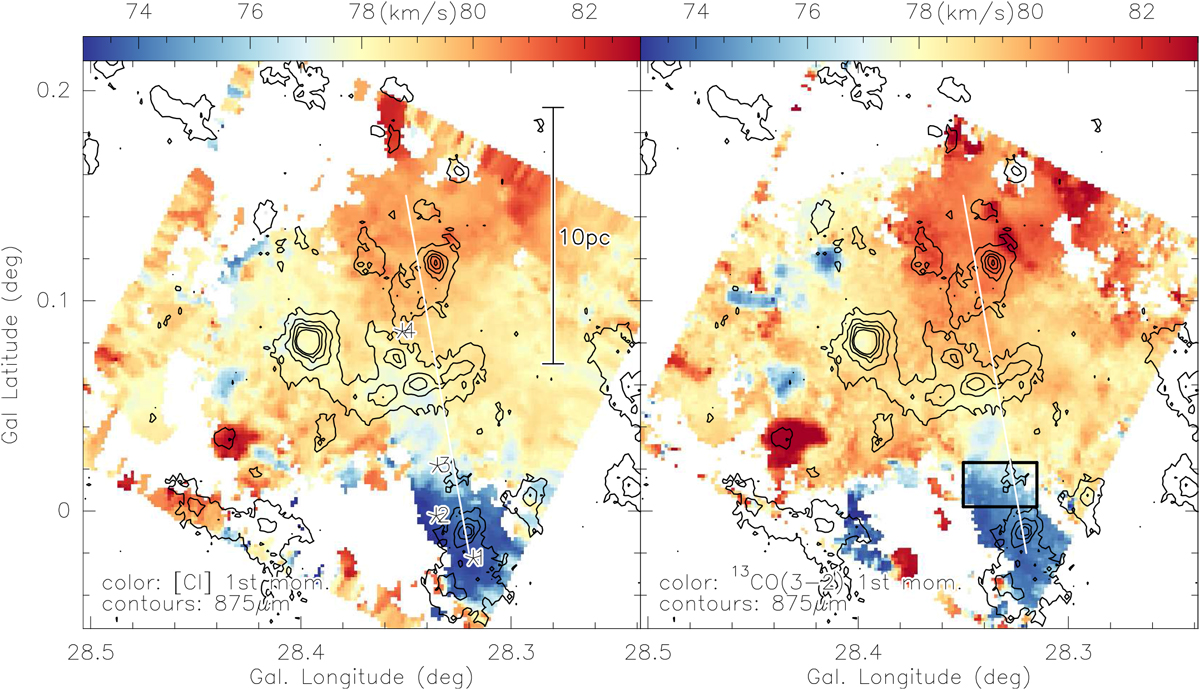
First moment maps (intensity-weighted peak velocities) of [CI] (left panel) and 13CO(3–2) (right panel)over a velocity range of [71,86] km s−1. The contours show the 875 μm emission from the ATLASGAL survey (Schuller et al. 2009; contour levels start at the 4σ level of 200 mJy beam−1 and continuein 8σ steps up to 1.8 Jy beam−1). The white lines show the direction (north to south) of the pv-diagrams in Fig. 9. The stars in the left panel show the positions of the spectra presented in Fig. 8. A scale bar is shown in the left panel. The black rectangle in the right panel outlines the region with the velocity jump.
Current usage metrics show cumulative count of Article Views (full-text article views including HTML views, PDF and ePub downloads, according to the available data) and Abstracts Views on Vision4Press platform.
Data correspond to usage on the plateform after 2015. The current usage metrics is available 48-96 hours after online publication and is updated daily on week days.
Initial download of the metrics may take a while.