Fig. 3
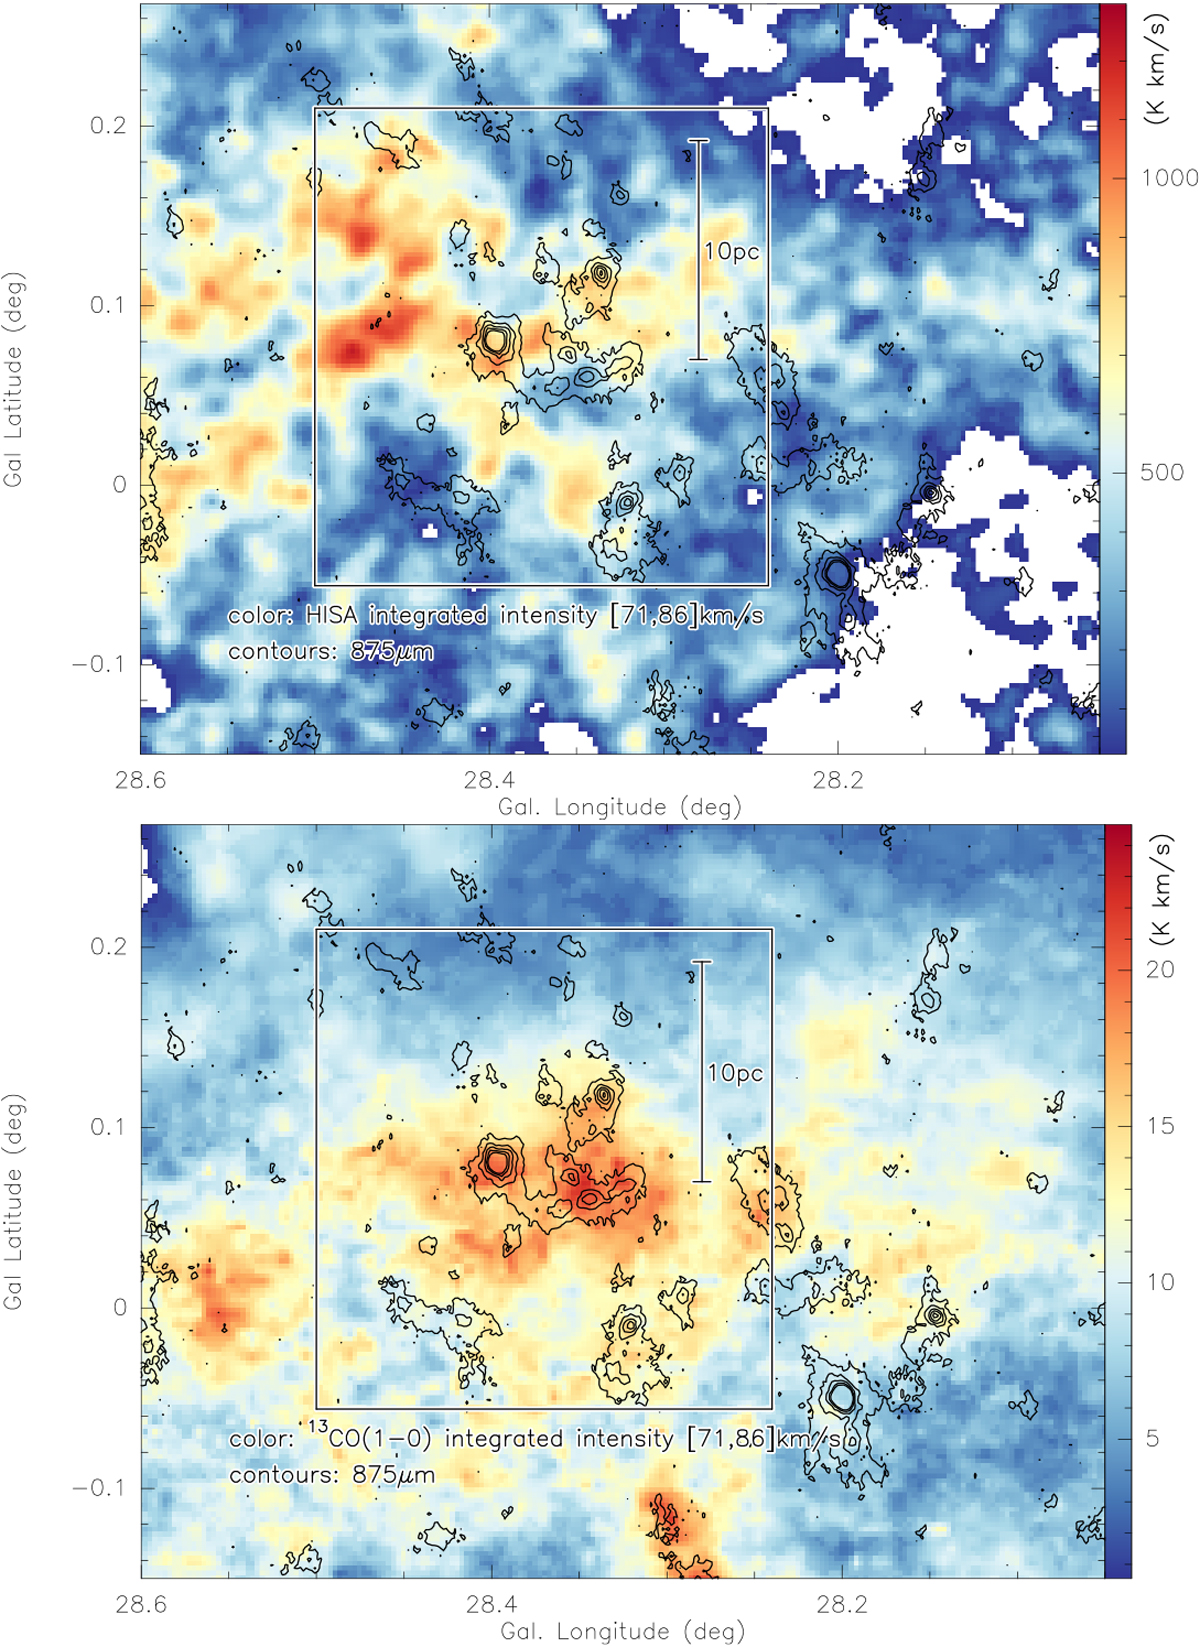
Large-scale structure of the cold neutral medium (CNM) measured as HISA in the THOR survey (top panel, Beuther et al. 2016; Wang et al. 2020a,b) and the 13CO(1–0) emission from GRS (bottom panel, Jackson et al. 2006). The color scales show the inverted HISA emission and 13CO(1–0) maps, respectively (integrated from 71 to 86 km s−1 above 15 K in the HISA spectrum), and the contours show the 875 μm emission from the ATLASGAL survey (Schuller et al. 2009, contour levels start at the 4σ level of 200 mJy beam−1 and continuein 8σ steps up to 1.8 Jy beam−1). The white box outlines the approximate region imaged with APEX in the [CI] and 13CO(3–2) emission. A scale bar is shown within the box.
Current usage metrics show cumulative count of Article Views (full-text article views including HTML views, PDF and ePub downloads, according to the available data) and Abstracts Views on Vision4Press platform.
Data correspond to usage on the plateform after 2015. The current usage metrics is available 48-96 hours after online publication and is updated daily on week days.
Initial download of the metrics may take a while.