Fig. 2
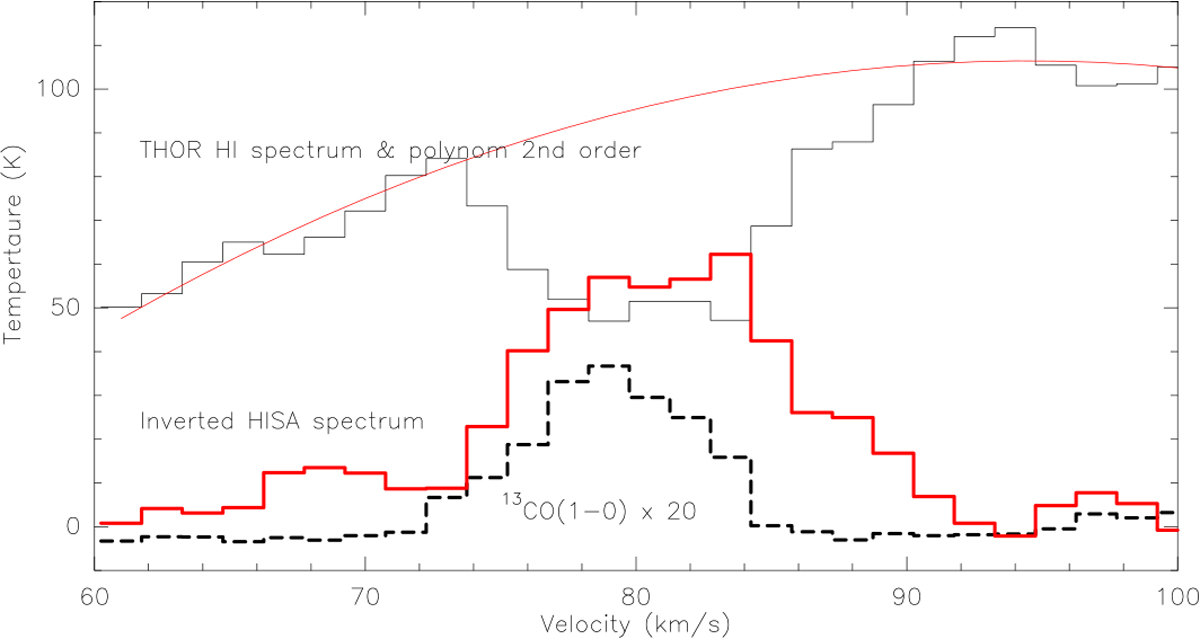
Compilation of HI and 13CO(1–0) spectra for the central area of the G28.3 IRDC (averaged over the central 100″ squared). The thin black histogram shows the original HI emission data from the THOR survey (Beuther et al. 2016; Wang et al. 2020a) where the HI self-absorption (HISA) is visible as absorption against the typically bright ~100 K emission of the Galaxy. The red line presents a second-order polynomial fit to the non-HISA part of the spectrum. The red histogram then shows the resulting inverted HISA spectrum for this feature. The dashed histogram presents the 13CO(1–0) emission (Jackson et al. 2006) for the same region (multiplied by 20 for easier readability).
Current usage metrics show cumulative count of Article Views (full-text article views including HTML views, PDF and ePub downloads, according to the available data) and Abstracts Views on Vision4Press platform.
Data correspond to usage on the plateform after 2015. The current usage metrics is available 48-96 hours after online publication and is updated daily on week days.
Initial download of the metrics may take a while.