Fig. 13
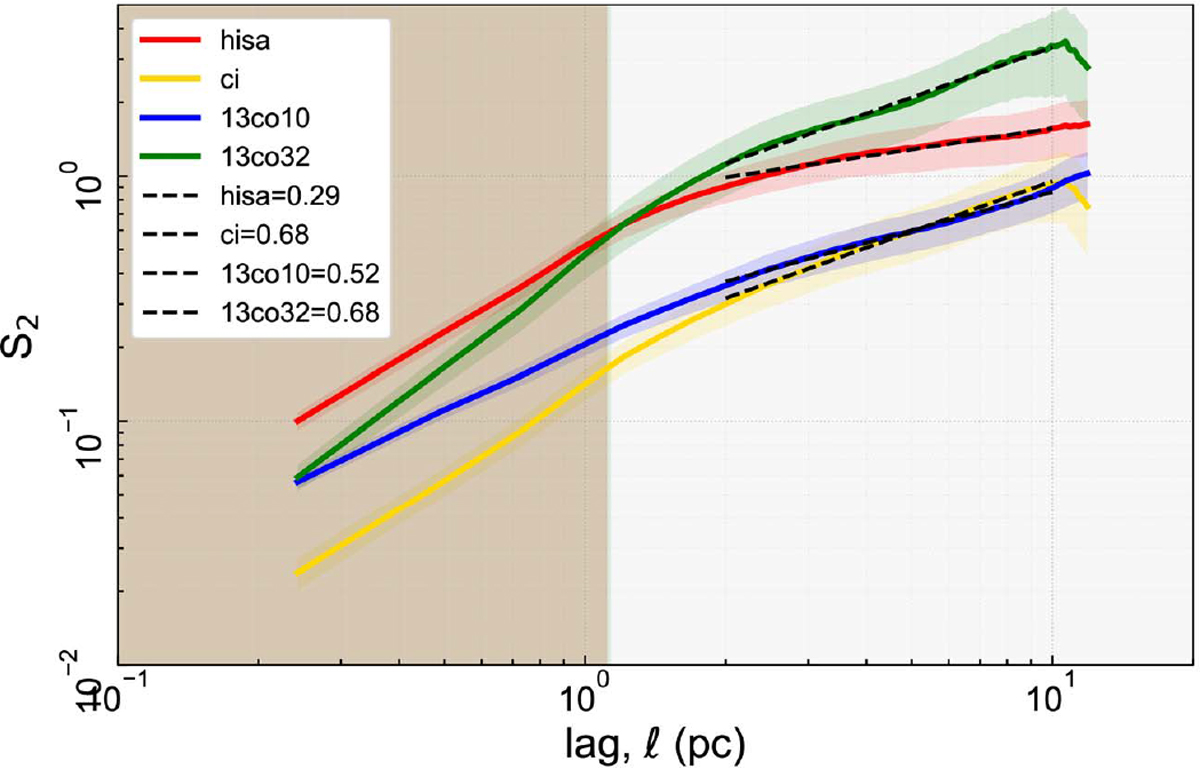
One-dimensional velocity structure function. The structure function S2 is plotted against the spatial lag l for all four observed gas tracers. The red, blue, yellow, and green lines correspond to the HISA, 13CO(1–0), [CI], and 13CO(3–2) data, respectively. The gray-shaded area is the spatial-resolution limit corresponding to the 46″ beam of the 13CO(1–0) data. The slopes are fitted outside that limit and are shown as dashed lines. The corresponding fit results are presented in the legend.
Current usage metrics show cumulative count of Article Views (full-text article views including HTML views, PDF and ePub downloads, according to the available data) and Abstracts Views on Vision4Press platform.
Data correspond to usage on the plateform after 2015. The current usage metrics is available 48-96 hours after online publication and is updated daily on week days.
Initial download of the metrics may take a while.