Fig. 12
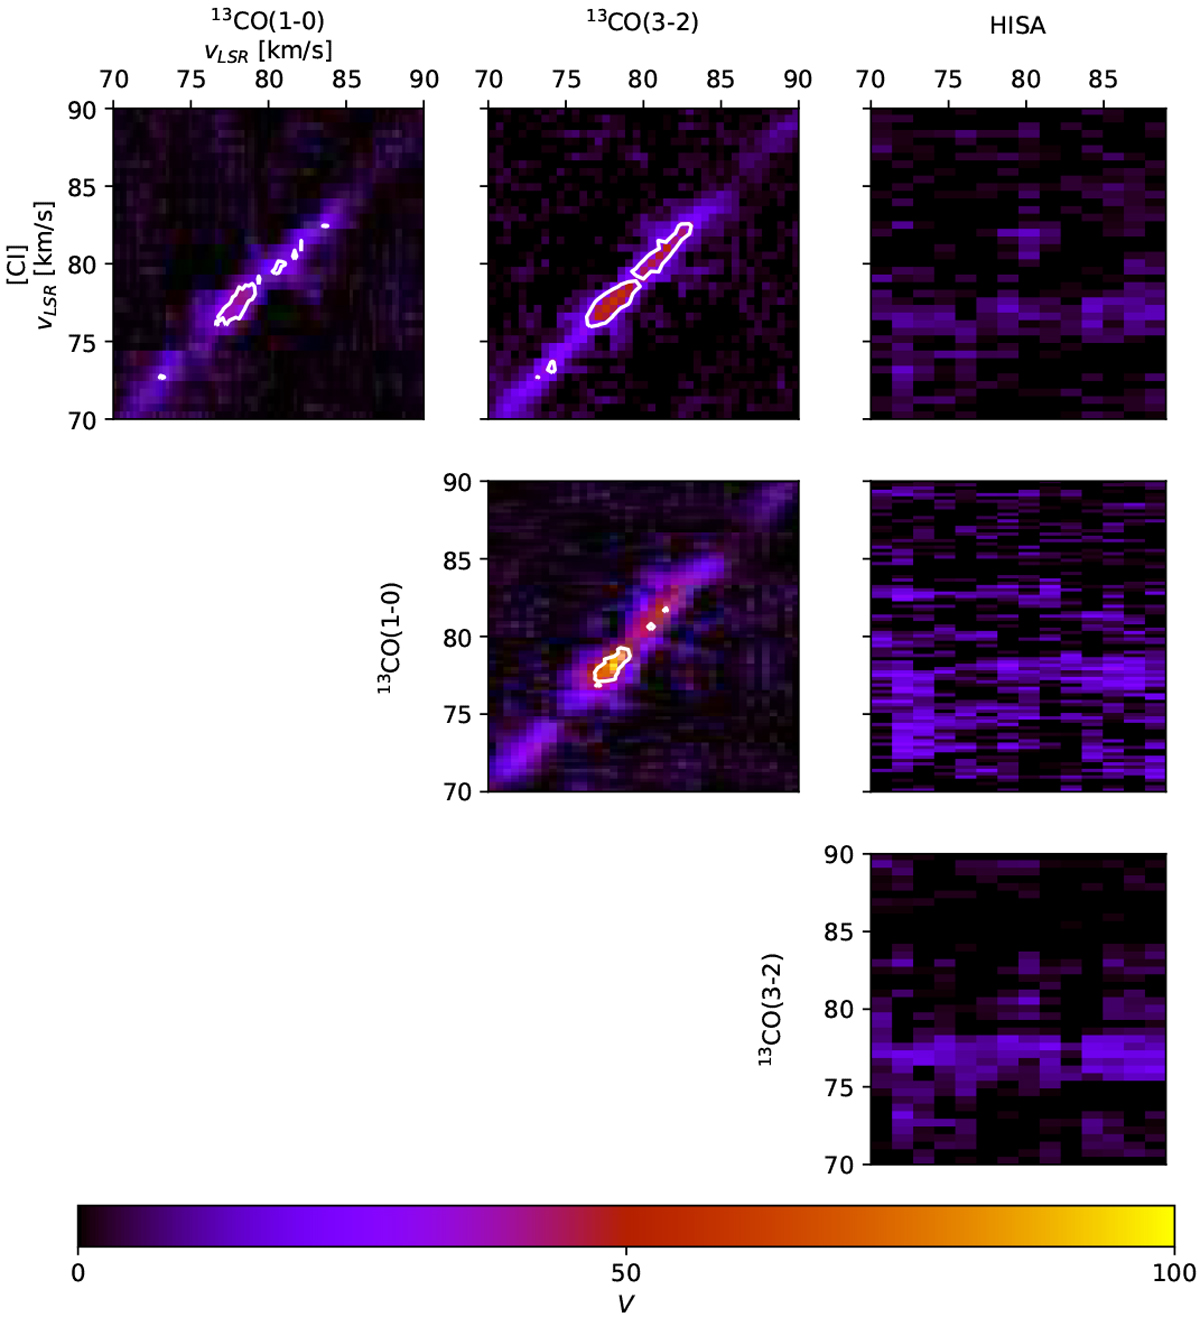
Spatial correlation between the four different tracers across velocity channels as evaluated using the histogram of oriented gradients method (HOG; Soler et al. 2019). The figure shows all tracers correlated with each other as labeled at each plot. The panels show the values of the projected Rayleigh statistic (V), a measure of the morphological correlation between velocity channels. A high value of V indicates a strong correlation between the corresponding velocity-channel maps. The contours correspond to the 7σ confidence limit on the V values (see Soler et al. 2019 for more details).
Current usage metrics show cumulative count of Article Views (full-text article views including HTML views, PDF and ePub downloads, according to the available data) and Abstracts Views on Vision4Press platform.
Data correspond to usage on the plateform after 2015. The current usage metrics is available 48-96 hours after online publication and is updated daily on week days.
Initial download of the metrics may take a while.