Fig. 11
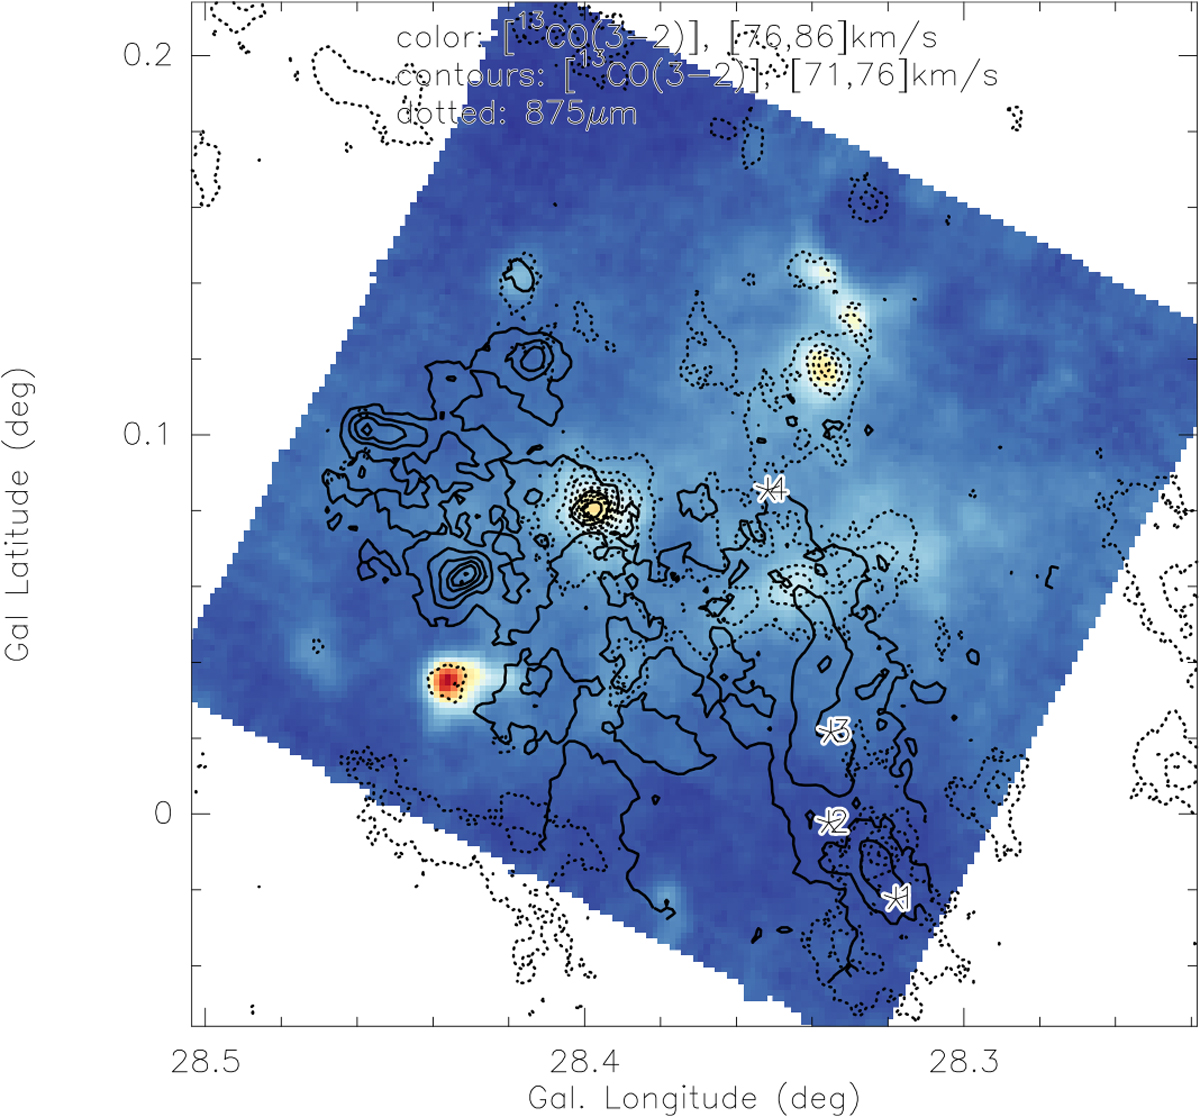
Integrated 13CO(3–2) emission for two velocity components. The color scale and full contours show the [76,86] and [71,76] km s−1 components,respectively. The contour levels are in 9σ steps (with 1σ = 0.125 K km s−1). The dotted contours show the corresponding 875 μm continuum emission from Schuller et al. (2009) as reference frame. The stars again show the positions of the spectra presented in Fig. 8.
Current usage metrics show cumulative count of Article Views (full-text article views including HTML views, PDF and ePub downloads, according to the available data) and Abstracts Views on Vision4Press platform.
Data correspond to usage on the plateform after 2015. The current usage metrics is available 48-96 hours after online publication and is updated daily on week days.
Initial download of the metrics may take a while.