Fig. 8.
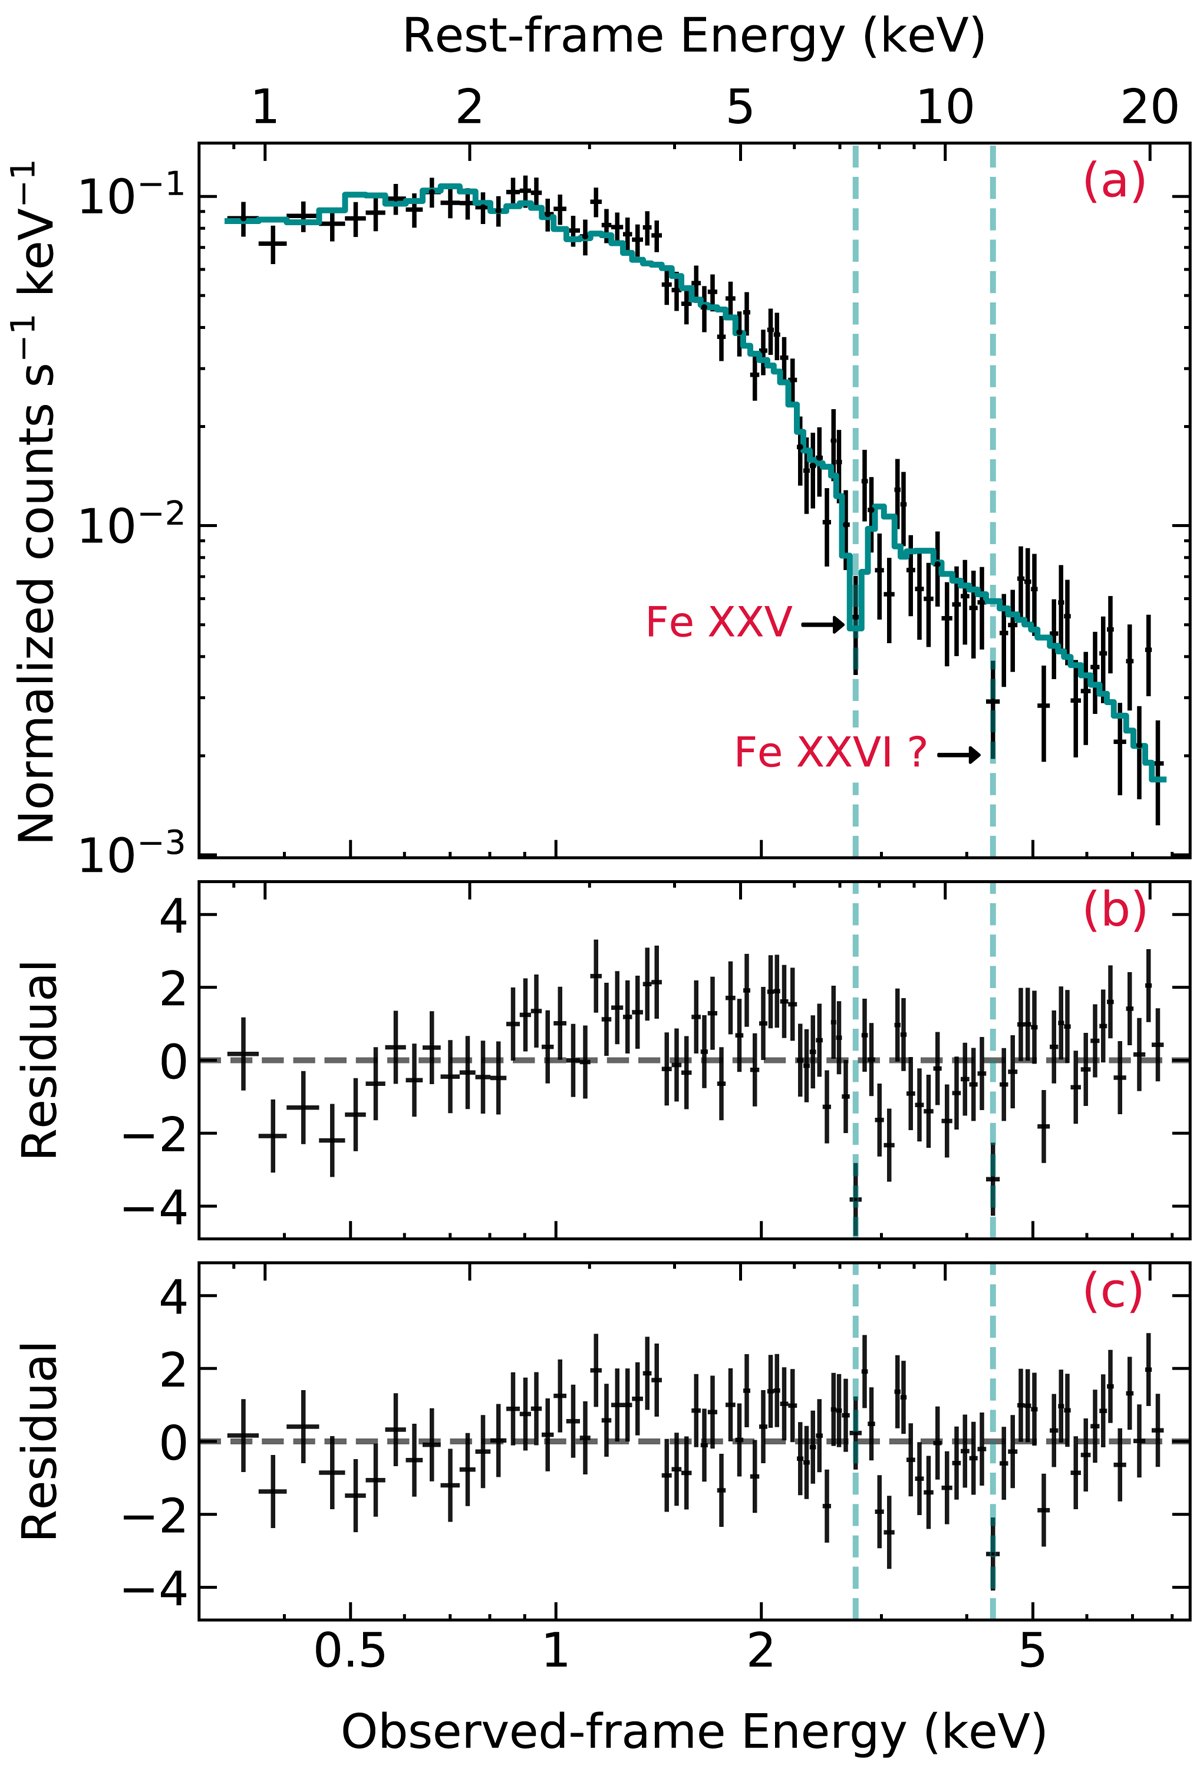
XMM 2002 EPIC-pn spectrum of Q2237. Panel a: XMM 2002 data (black) and best-fit model (solid blue line) with Model pl_wa. The dashed blue lines indicate the UFO signatures. Panel b: XMM 2002 best-fit residuals for Model pl. Panel c: XMM 2002 best-fit residuals for Model pl_wa. The latter model self-consistently accounts for the absorption line at Erf ≃ 7.4 keV. The data are grouped to obtain at least 20 cts/bin, with the minimum energy width set to one third of the CCD energy resolution. The best-fit parameters are summarized in Table 5. Due to background-dominated bins above 8.0 keV, we restricted the fitting to the 0.3–8 keV observed-energy range (0.8–22 keV rest-frame energy range).
Current usage metrics show cumulative count of Article Views (full-text article views including HTML views, PDF and ePub downloads, according to the available data) and Abstracts Views on Vision4Press platform.
Data correspond to usage on the plateform after 2015. The current usage metrics is available 48-96 hours after online publication and is updated daily on week days.
Initial download of the metrics may take a while.