Fig. 4.
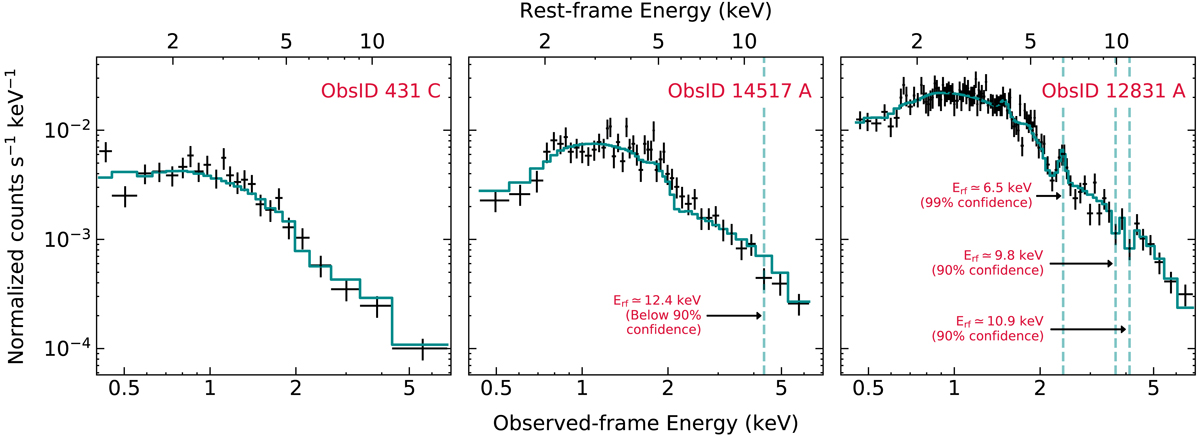
Data (black) and best-fit model (blue) for three of the Chandra HSS spectra, representative of three statistics regimes. From left to right: ObsID 431 C (least counts), 14517 A (intermediate counts), and 12831 A (highest counts). The dashed vertical lines indicate the energies of the emission and absorption lines found by adopting the blind-search method of Tombesi et al. (2010). Only those above 90% confidence were included in the best-fit models (i.e., those in Tables 4a and 4b).
Current usage metrics show cumulative count of Article Views (full-text article views including HTML views, PDF and ePub downloads, according to the available data) and Abstracts Views on Vision4Press platform.
Data correspond to usage on the plateform after 2015. The current usage metrics is available 48-96 hours after online publication and is updated daily on week days.
Initial download of the metrics may take a while.