Fig. 5
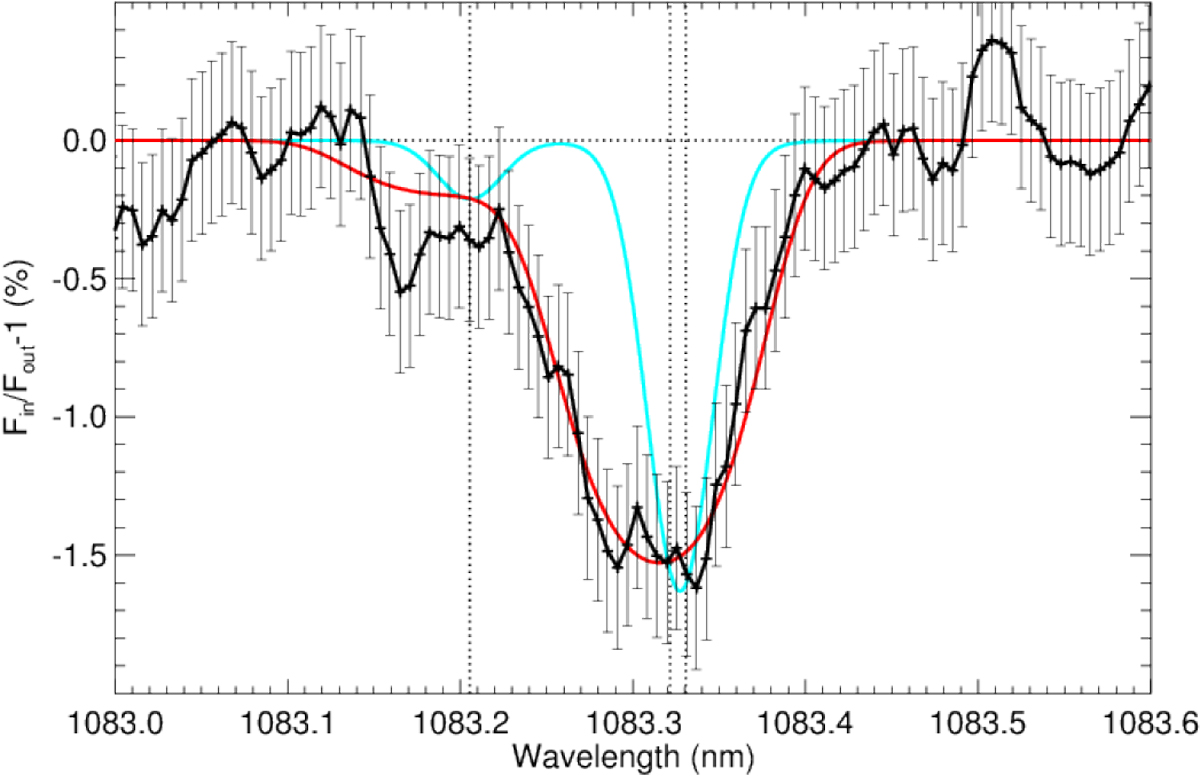
Transmission spectrum of the He I triplet during transit. Measured absorption (+), and their respective estimated errors, are shown in black. The data are the same as in Fig. 3 but with a three-point running mean applied. The cyan curve shows the absorption profile when only the Doppler and turbulence broadenings are included. The red curve is the best-fit model obtained for an effective temperature of 6000 K, a mass-loss rate (Ṁ) of 3 × 10¹⁰ g s−1 and a H/He mole-fraction ratio of 90/10. This calculation included, in addition to the Doppler and turbulence broadenings, the broadening induced by the radial velocities of the model and an additional blue net wind of –3.2 km s−1. The positions of the three He I lines are marked by vertical dotted lines.
Current usage metrics show cumulative count of Article Views (full-text article views including HTML views, PDF and ePub downloads, according to the available data) and Abstracts Views on Vision4Press platform.
Data correspond to usage on the plateform after 2015. The current usage metrics is available 48-96 hours after online publication and is updated daily on week days.
Initial download of the metrics may take a while.