Fig. 3
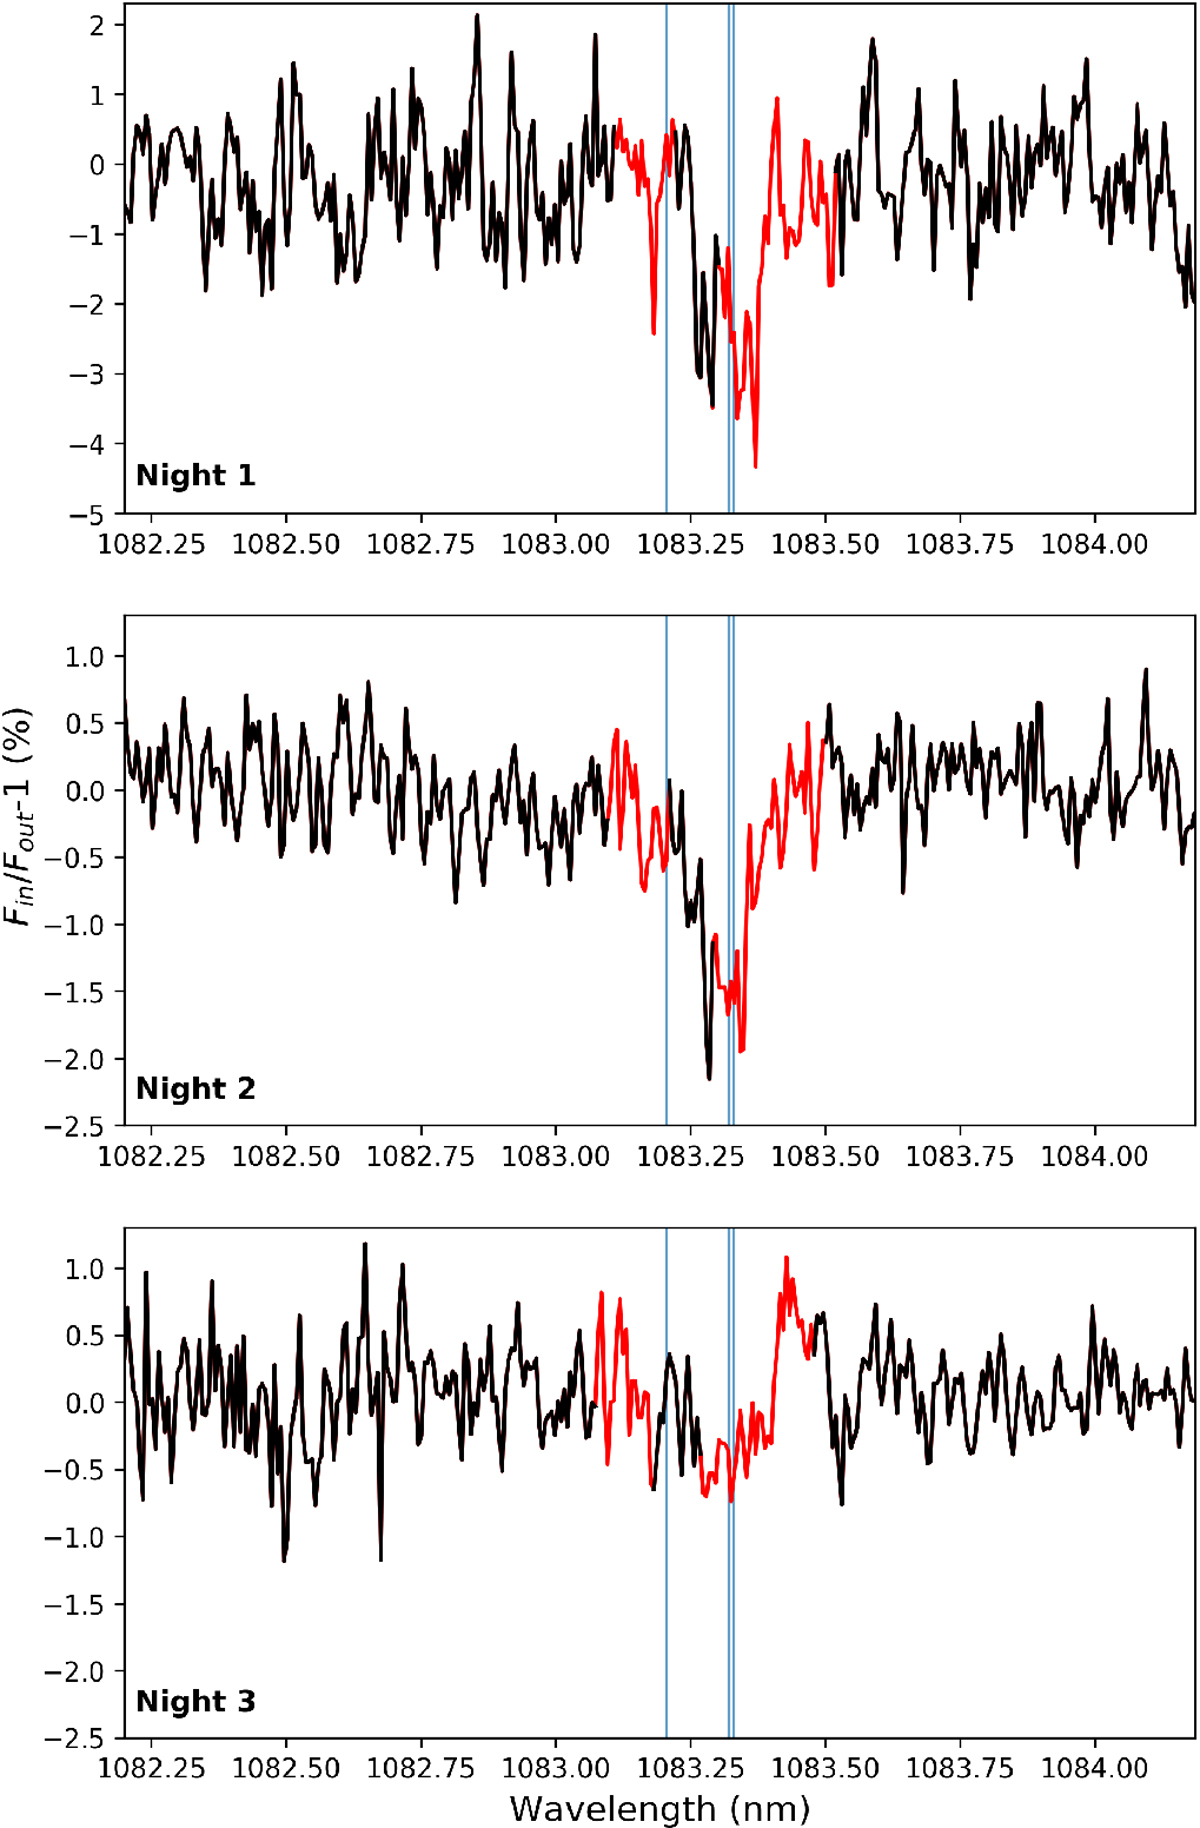
Mid-transit (T2-T3) transmission spectrum around the HeI triplet for nights 1, 2 and 3, from top to bottom, respectively. The black line shows the spectral regions unaffected by OH− lines, while the red line marks the spectral regions affected, and corrected for, OH− emission. The blue vertical lines mark the helium triplet line center positions. Note the different absorption scale between night 1 and nights 2 and 3.
Current usage metrics show cumulative count of Article Views (full-text article views including HTML views, PDF and ePub downloads, according to the available data) and Abstracts Views on Vision4Press platform.
Data correspond to usage on the plateform after 2015. The current usage metrics is available 48-96 hours after online publication and is updated daily on week days.
Initial download of the metrics may take a while.