Fig. 2
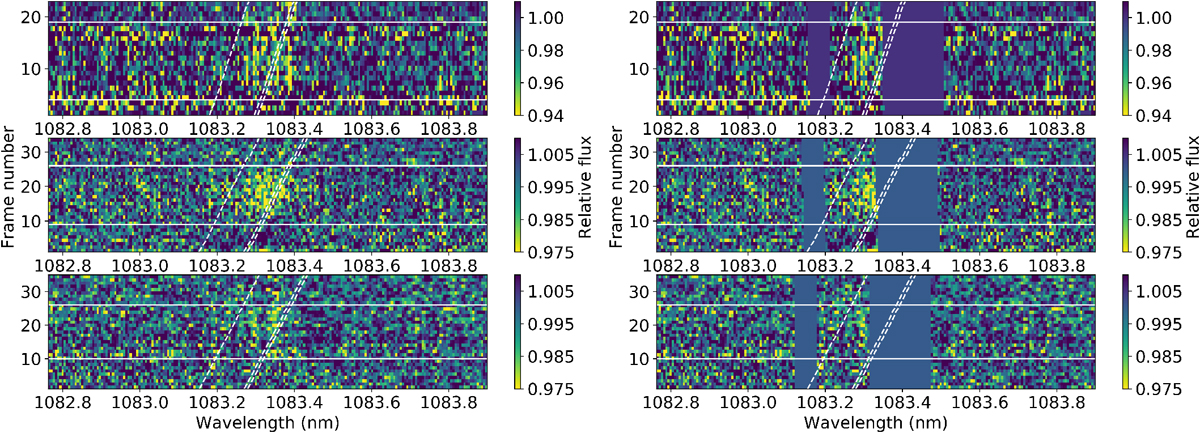
Observed 2D residual maps after dividing each spectrum by the master-out spectrum. Form top to bottom: nights 1, 2 and 3, respectively. The data on the right and left panels are exactly the same, but in the right panel, the regions affected by OH− contamination are masked to illustrate the amount of usable data for each night. The maps comprise the region around the He I triplet, and are shown in the stellar rest frame. The horizontal white bars mark the beginning (T1) and end (T4) of the transit. The tilted dashed lines mark the expected planetary trail of triplet. Note the different color scale between night 1 and nights 2 and 3.
Current usage metrics show cumulative count of Article Views (full-text article views including HTML views, PDF and ePub downloads, according to the available data) and Abstracts Views on Vision4Press platform.
Data correspond to usage on the plateform after 2015. The current usage metrics is available 48-96 hours after online publication and is updated daily on week days.
Initial download of the metrics may take a while.