Fig. 1
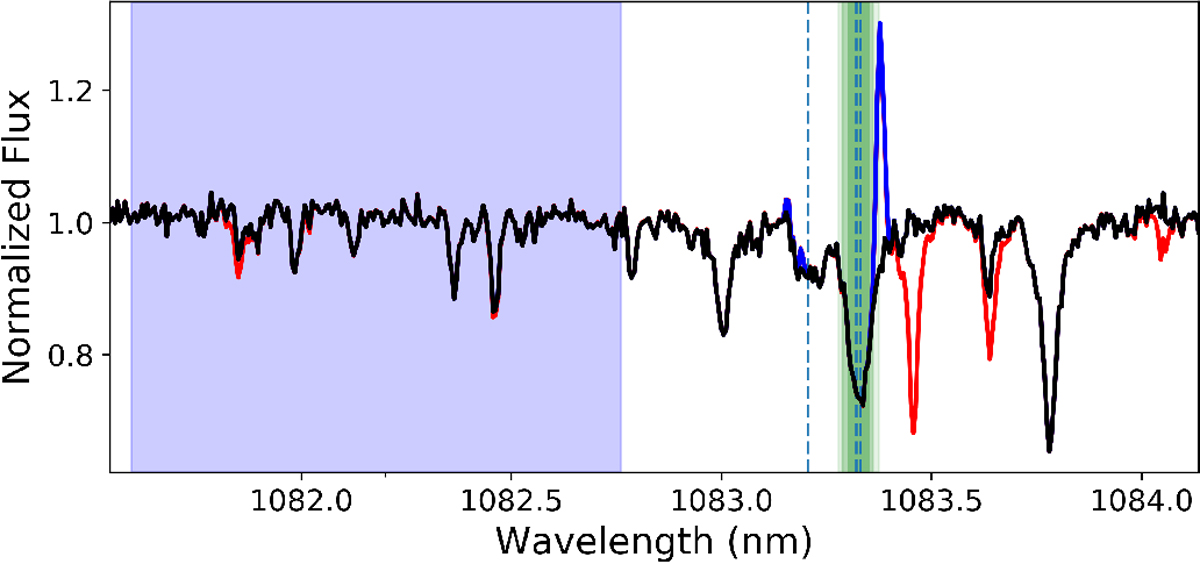
Zoom of one CARMENES spectrum of GJ 3470 in the wavelength region containing the He I triplet. In red the raw spectra after standard data reduction is plotted. Over-plotted in blue is the same spectrum after removal of the telluric features (mainly water in this region) using molecfit. In black is the same spectrum after adjusting and removing also the OH− spectral features. In the figure, the wavelength region used to normalize the continuum of all spectra is marked with a blue shade, and the region around the He I line cores used to calculate the spectro-photometric transit light curves is marked with a shaded green region.
Current usage metrics show cumulative count of Article Views (full-text article views including HTML views, PDF and ePub downloads, according to the available data) and Abstracts Views on Vision4Press platform.
Data correspond to usage on the plateform after 2015. The current usage metrics is available 48-96 hours after online publication and is updated daily on week days.
Initial download of the metrics may take a while.