Fig. 6.
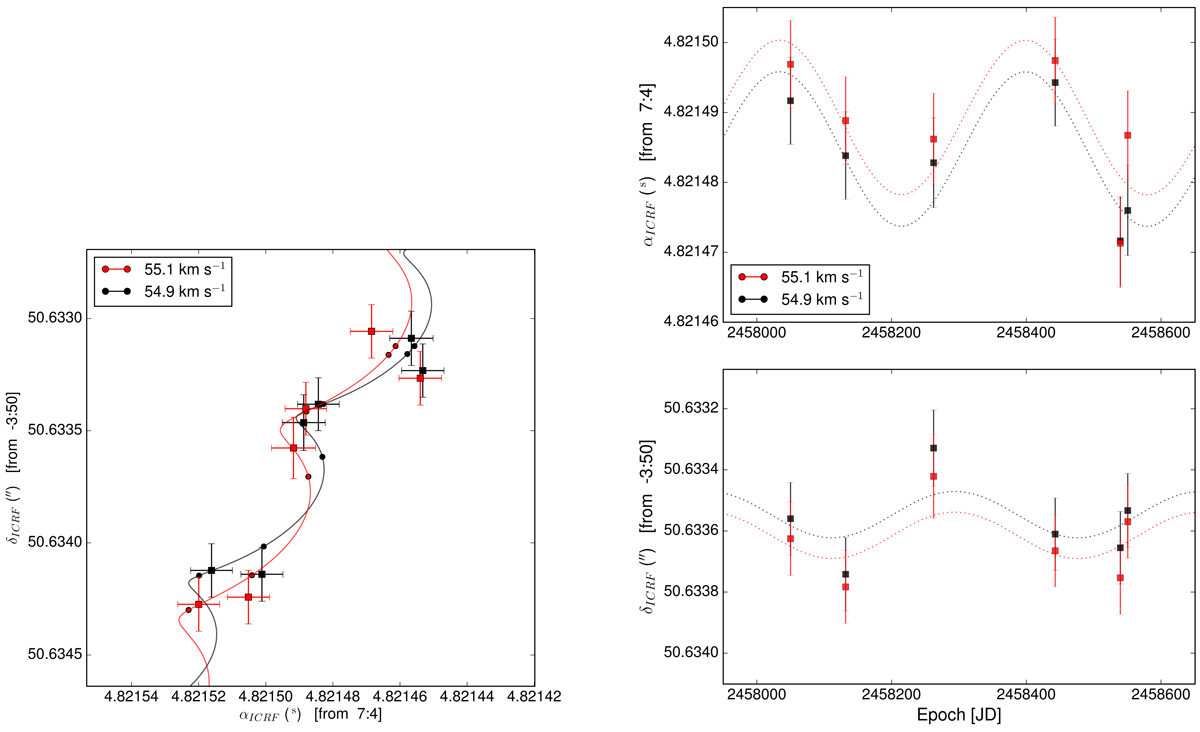
Left: measured VLBA sky positions of V838 Mon maser spots in two contiguous channels (black and red squares). The line corresponds to the best fit to the data while the filled circles are the expected positions from this fit at the observed epochs. Rigth: right ascension (upper panel) and declination (lower panel) of the maser spots as a function of time after subtracting the fit proper motions to see only the effect of the parallax.
Current usage metrics show cumulative count of Article Views (full-text article views including HTML views, PDF and ePub downloads, according to the available data) and Abstracts Views on Vision4Press platform.
Data correspond to usage on the plateform after 2015. The current usage metrics is available 48-96 hours after online publication and is updated daily on week days.
Initial download of the metrics may take a while.