Fig. 5.
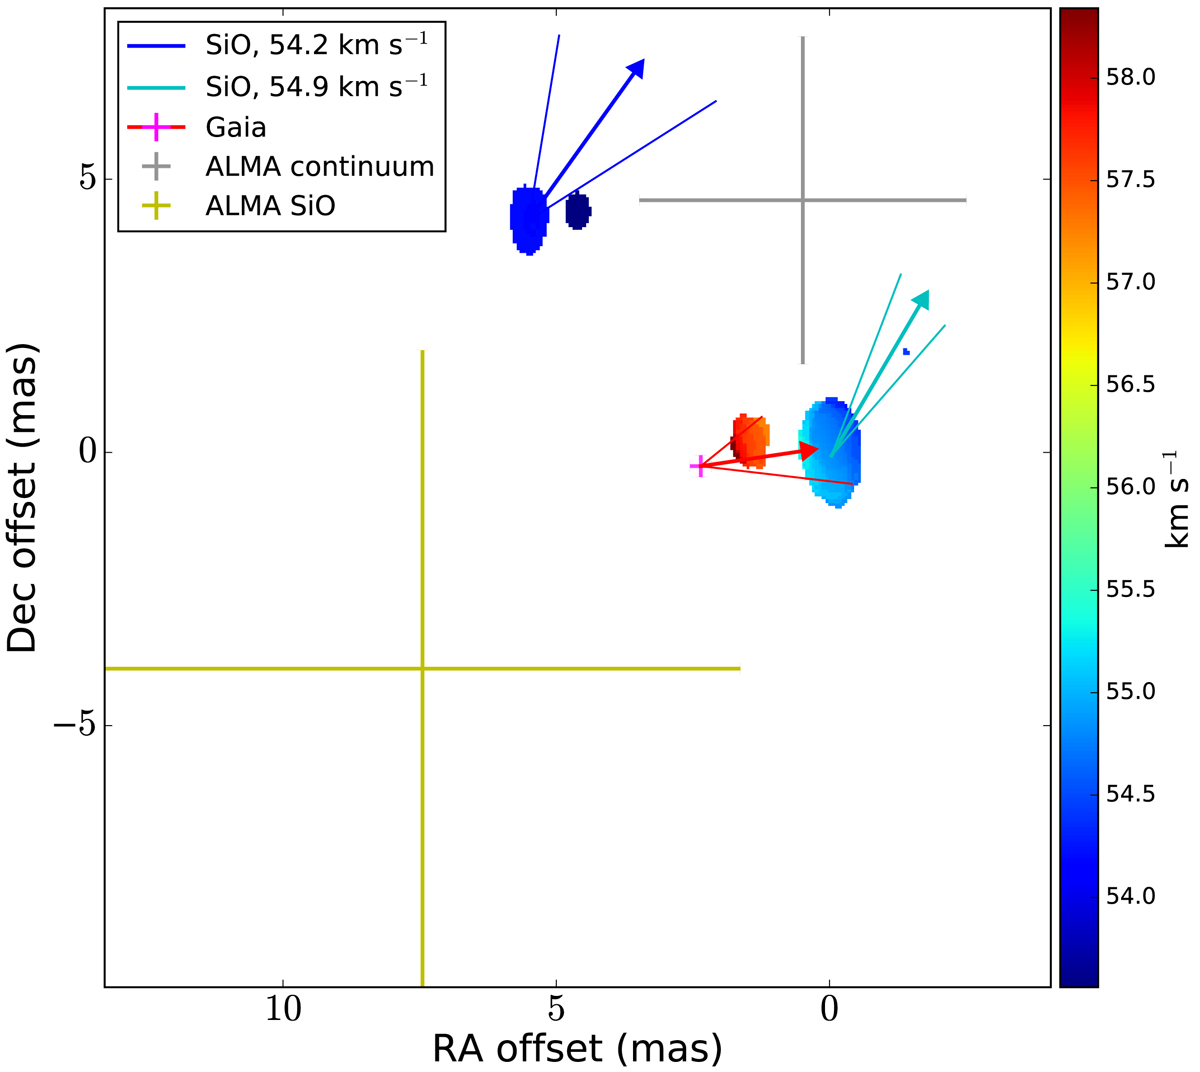
Location of the spots detected on January 13, 2018 for the v = 1, J = 1−0 SiO maser transition. The proper motion vectors of the two strongest spots (at 54.9 and 54.2 km s−1) are indicated by the cyan and blue arrows, respectively. A third spot is detected at ∼58 km s−1 and located at ∼1 mas to the east of the strongest spot. The location of the Gaia source and its proper motion is indicated by the pink cross and the red arrow, respectively. The lines associated to the arrows indicate the proper motion errors. The gray and yellow crosses mark the positions and uncertainties of the continuum and SiO extended emission peaks detected in the ALMA maps, respectively.
Current usage metrics show cumulative count of Article Views (full-text article views including HTML views, PDF and ePub downloads, according to the available data) and Abstracts Views on Vision4Press platform.
Data correspond to usage on the plateform after 2015. The current usage metrics is available 48-96 hours after online publication and is updated daily on week days.
Initial download of the metrics may take a while.