Open Access
Fig. 4.
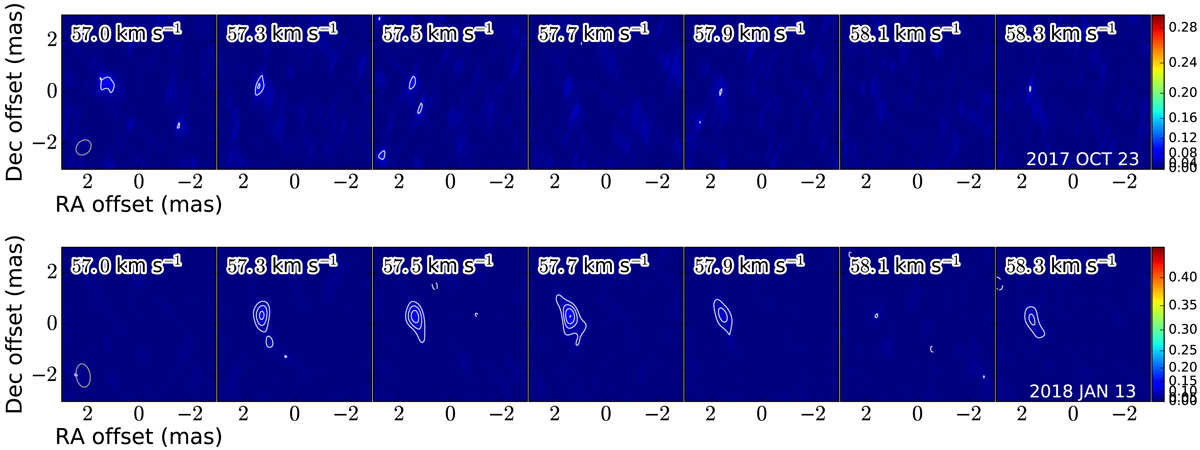
Channel velocity maps (Jy beam−1) of the SiO maser (v = 1, J = 1−0) emission from the third spot. The offsets are relative to the peak position of the strongest spot in each epoch. The contour levels are at 3σ, 5σ, 7σ, and 9σ.
Current usage metrics show cumulative count of Article Views (full-text article views including HTML views, PDF and ePub downloads, according to the available data) and Abstracts Views on Vision4Press platform.
Data correspond to usage on the plateform after 2015. The current usage metrics is available 48-96 hours after online publication and is updated daily on week days.
Initial download of the metrics may take a while.