Fig. 2.
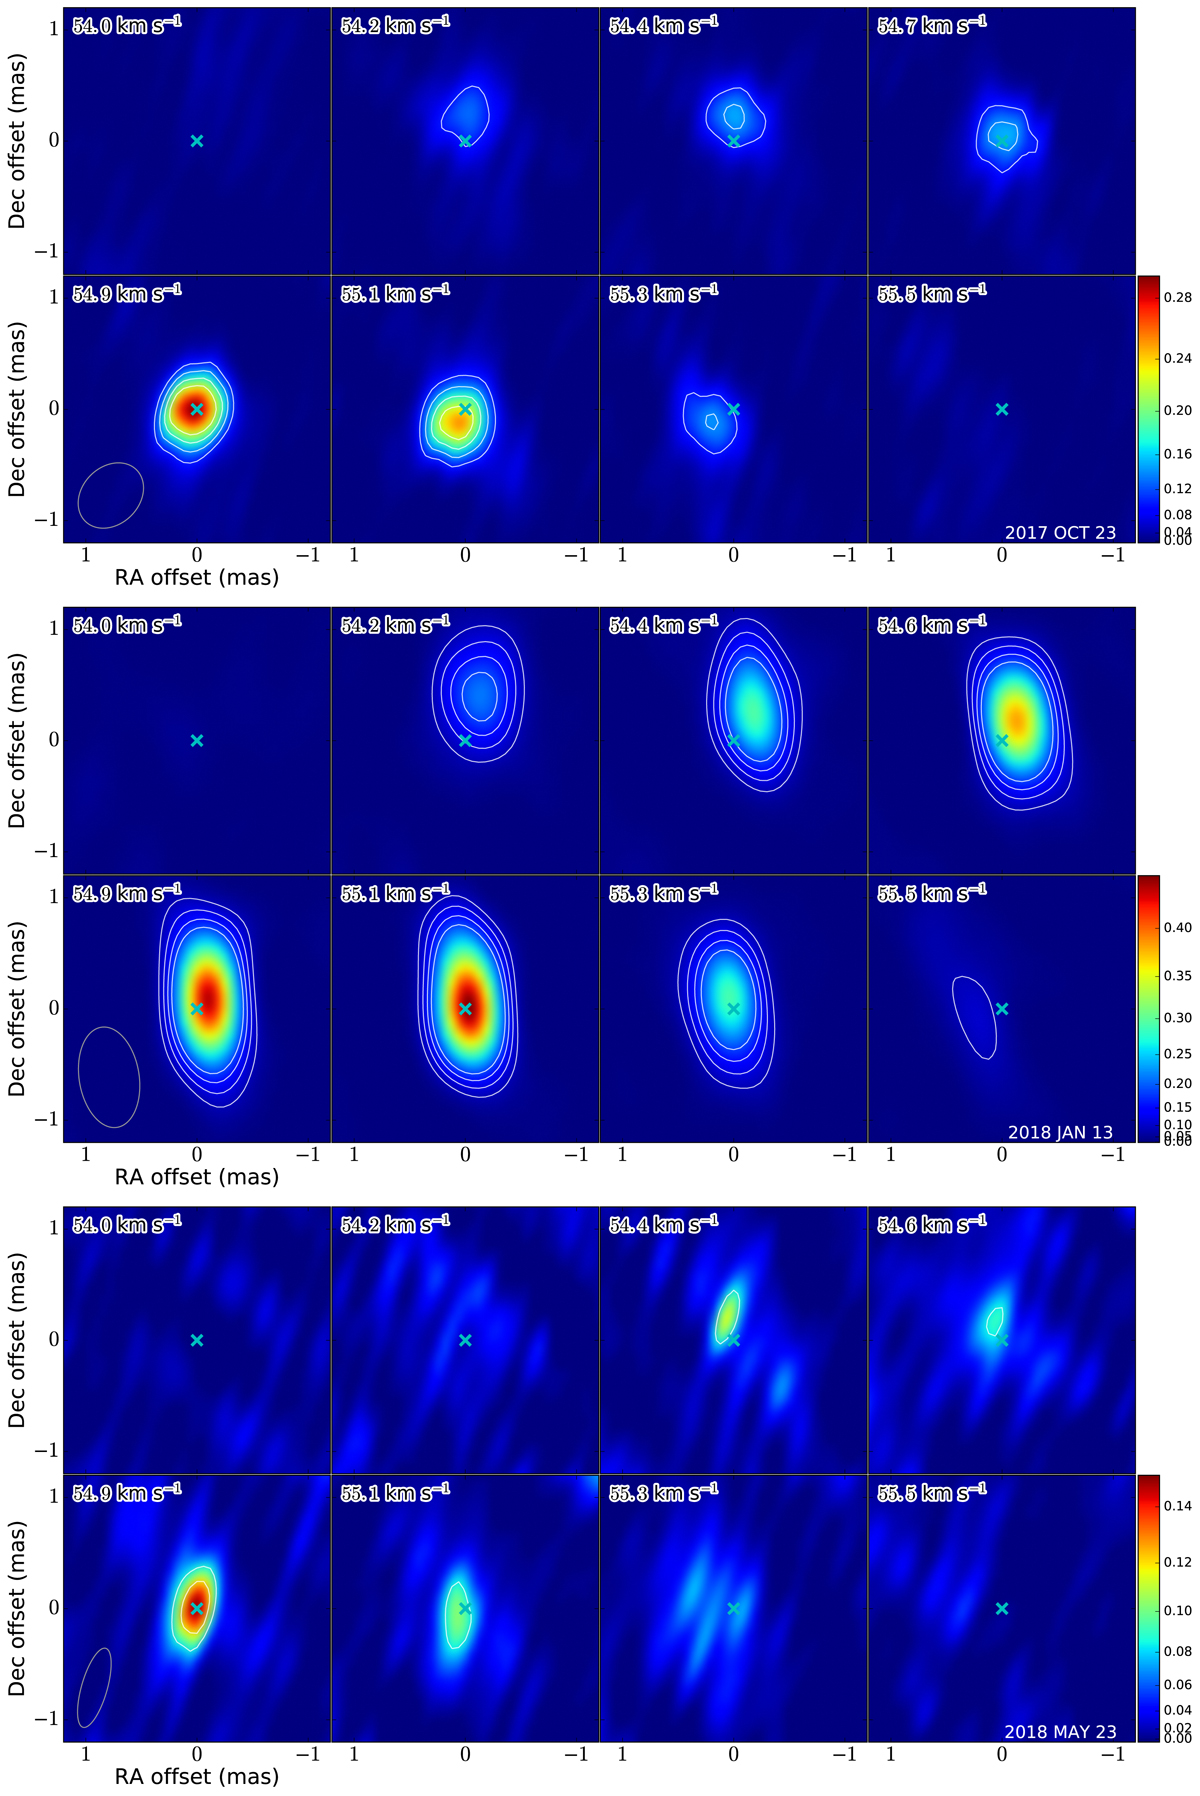
Channel velocity map (Jy beam−1) of the SiO maser (v = 1, J = 1−0) emission for the epoch as indicated by the label in the last panel. The contour levels are at 5σ, 7σ, 9σ, and 11σ, where σ is the rms noise measured in the strongest channel of the image cube (Table 1). Position offsets are relative to the position of the strongest pixel in the channel that has the maximum peak flux (cyan cross mark).
Current usage metrics show cumulative count of Article Views (full-text article views including HTML views, PDF and ePub downloads, according to the available data) and Abstracts Views on Vision4Press platform.
Data correspond to usage on the plateform after 2015. The current usage metrics is available 48-96 hours after online publication and is updated daily on week days.
Initial download of the metrics may take a while.