Fig. 9.
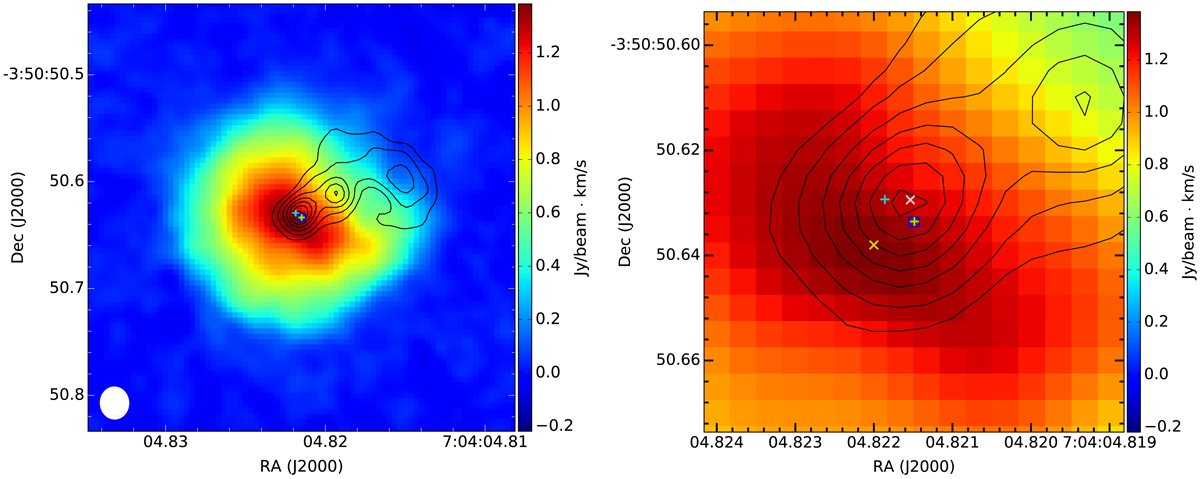
Moment zero map of the SiO molecular emission observed with ALMA. The contours show the continuum emission at 10, 20, 35, 50, 65, 80, and 95% of the peak emission. The positions of the SiO masers detected with the VLBA are indicated by two the pluses and the square. Right panel: zoom-in of the central part of the map. The white and yellow crosses mark the continuum and SiO extended emission peaks detected in the ALMA maps, respectively.
Current usage metrics show cumulative count of Article Views (full-text article views including HTML views, PDF and ePub downloads, according to the available data) and Abstracts Views on Vision4Press platform.
Data correspond to usage on the plateform after 2015. The current usage metrics is available 48-96 hours after online publication and is updated daily on week days.
Initial download of the metrics may take a while.