Free Access
Fig. 2.
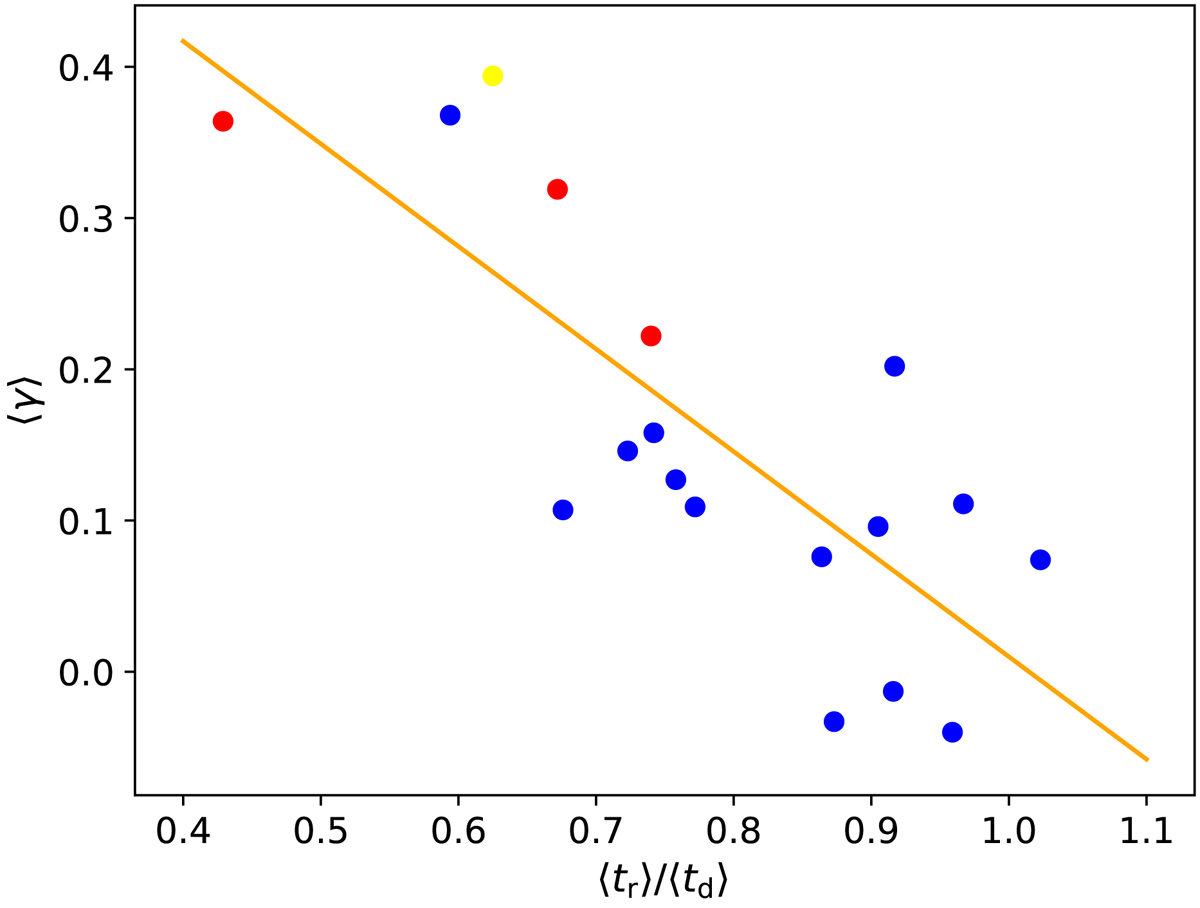
Ratio of average rise time and average decline time vs. average skewness. Blue dots represent main-sequence stars, and red dots giants. The Sun is shown in yellow. The continuous line shows the best linear fit.
Current usage metrics show cumulative count of Article Views (full-text article views including HTML views, PDF and ePub downloads, according to the available data) and Abstracts Views on Vision4Press platform.
Data correspond to usage on the plateform after 2015. The current usage metrics is available 48-96 hours after online publication and is updated daily on week days.
Initial download of the metrics may take a while.