Free Access
Fig. 11.
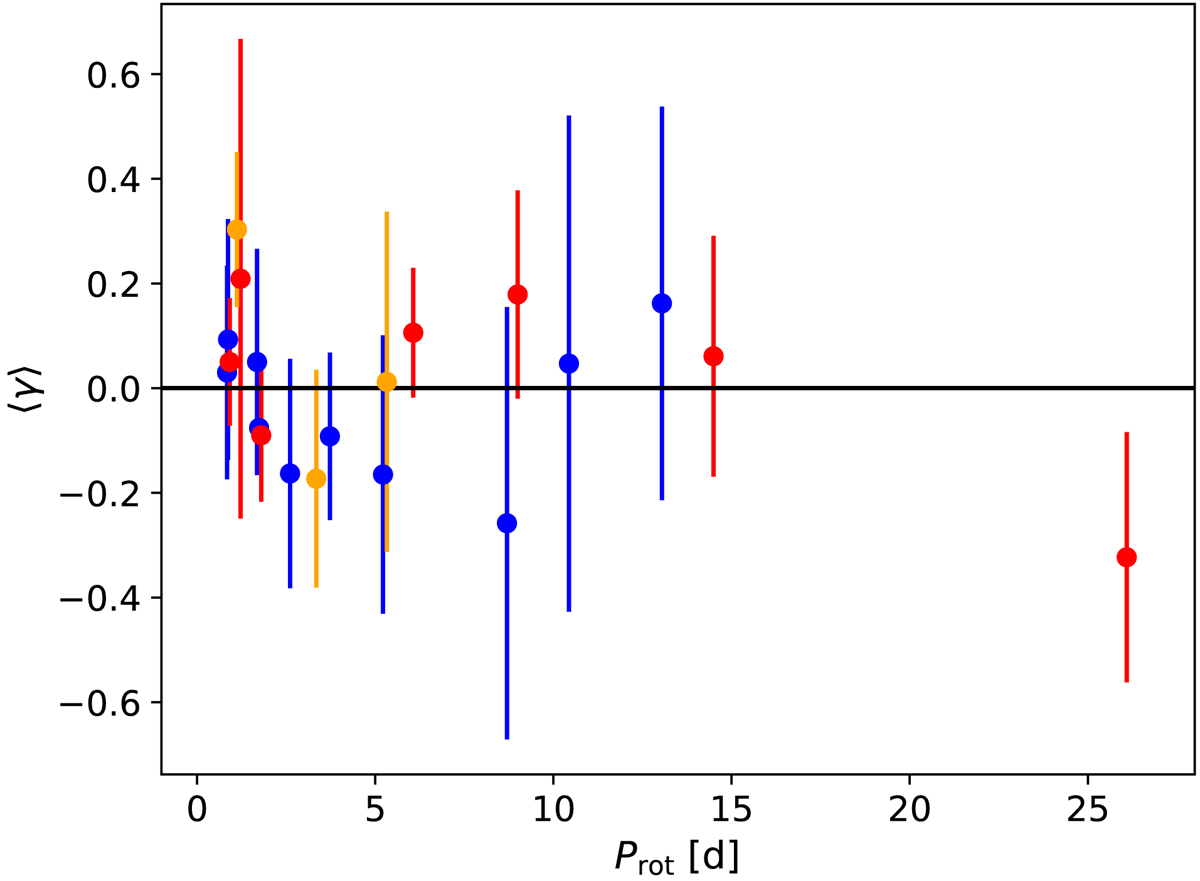
Mean skewness of the simulated cycles as a function of Prot. The error bars represent the standard deviation of the cycles in the run. Global runs are shown in red, with the high-resolution runs in orange and the wedge runs in blue. The horizontal line represents γ = 0.
Current usage metrics show cumulative count of Article Views (full-text article views including HTML views, PDF and ePub downloads, according to the available data) and Abstracts Views on Vision4Press platform.
Data correspond to usage on the plateform after 2015. The current usage metrics is available 48-96 hours after online publication and is updated daily on week days.
Initial download of the metrics may take a while.