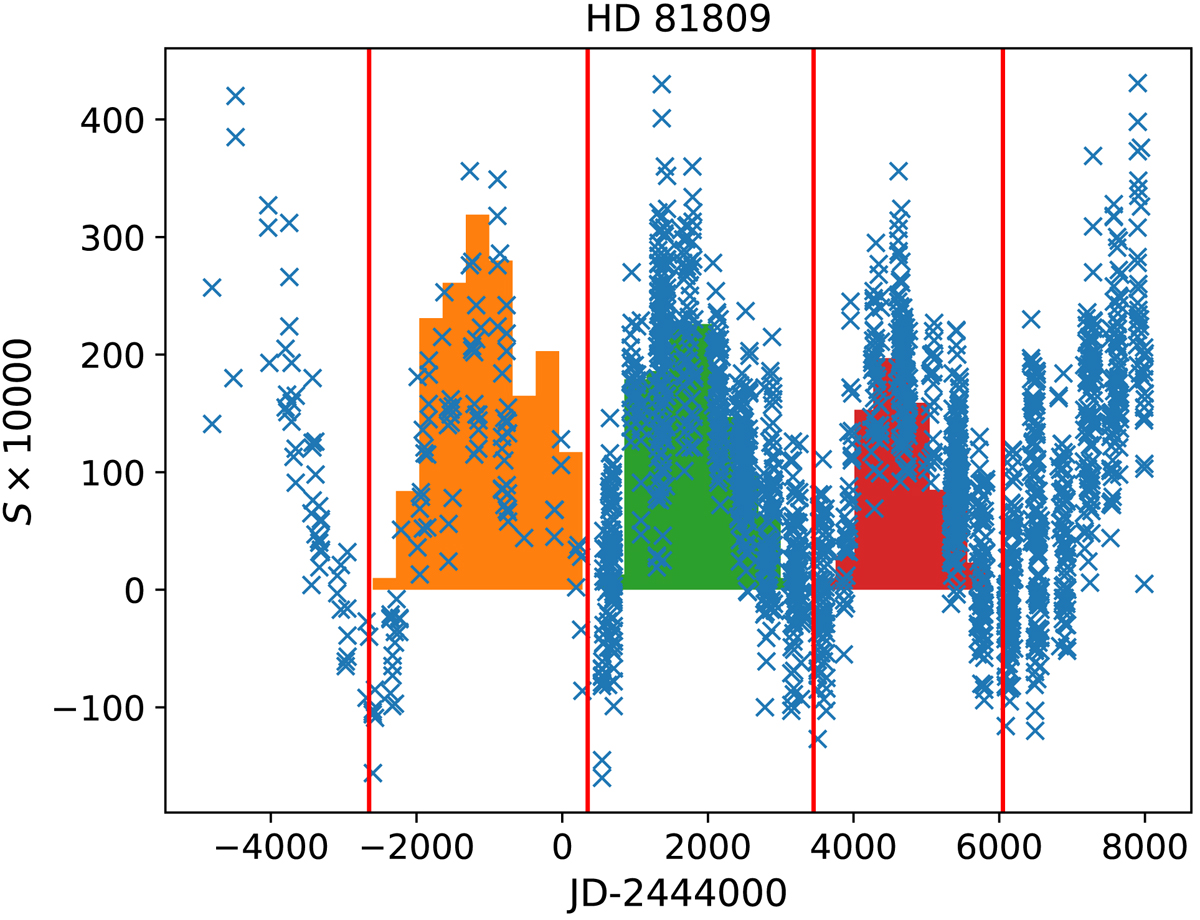
Fig. 1.

Cycles of HD 81809. The crosses are the original calibrated MW data, and the histograms are the distributions built from these. Vertical lines show the times of minima, dividing the data set into three complete cycles. The zero-levels of the histograms are defined individually for each cycle, but here they are plotted on the same level. The correct individual shifts for each cycle are therefore missing in the visualisation for simplicity. The value on the y-axis, S × 10 000 (which has been shifted in the y-direction), equals the number of data points in a bin, n.
Current usage metrics show cumulative count of Article Views (full-text article views including HTML views, PDF and ePub downloads, according to the available data) and Abstracts Views on Vision4Press platform.
Data correspond to usage on the plateform after 2015. The current usage metrics is available 48-96 hours after online publication and is updated daily on week days.
Initial download of the metrics may take a while.


