Fig. 9.
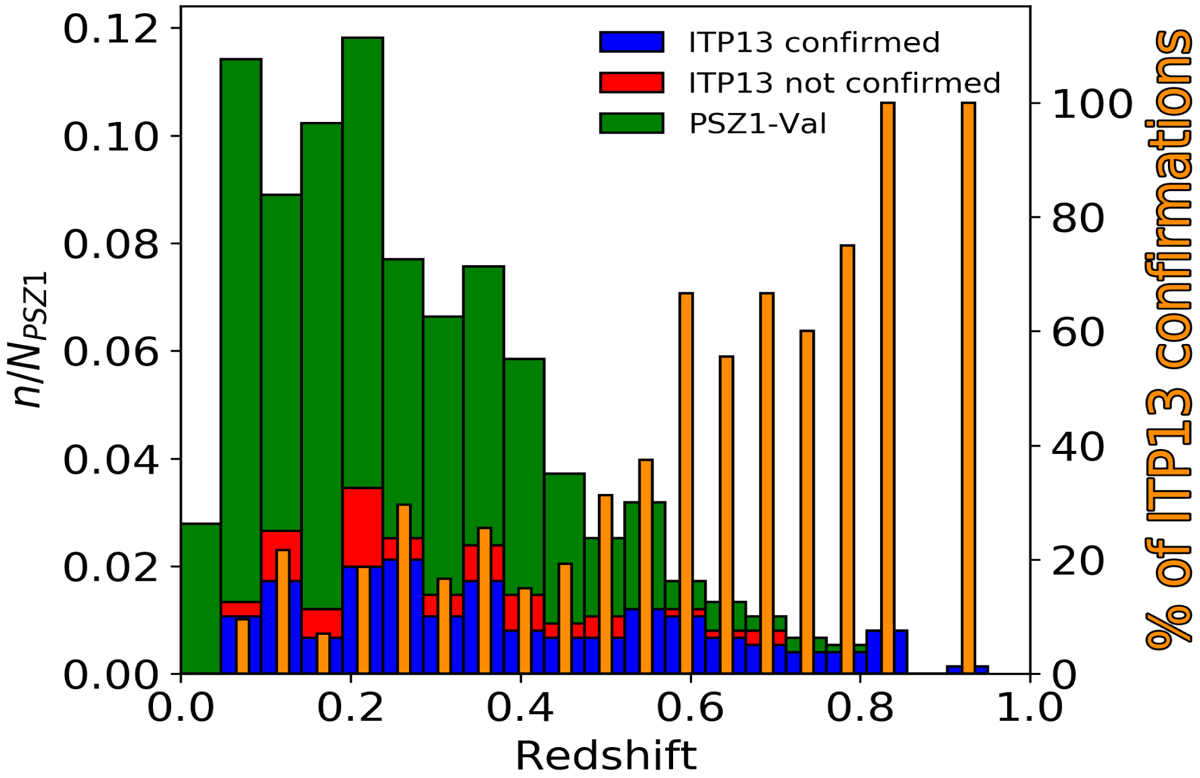
Fraction of PSZ1 sources as a function of redshift and normalised to the total number of PSZ1-North sources. The PSZ1-Val sample is represented in green. Blue and red bars correspond to the ITP sample, classified as confirmed (with Flag=1 and 2) and unconfirmed (Flag=3) sources, respectively. Orange vertical bars show the fraction of SZ sources confirmed during the full ITP13 programme.
Current usage metrics show cumulative count of Article Views (full-text article views including HTML views, PDF and ePub downloads, according to the available data) and Abstracts Views on Vision4Press platform.
Data correspond to usage on the plateform after 2015. The current usage metrics is available 48-96 hours after online publication and is updated daily on week days.
Initial download of the metrics may take a while.